- May 3
If You Think Treating Symptoms Is the Same as Solving the Root Cause, You'd Be a Terrible Doctor
- Arnaud Lemaire
- Accounting & Auditing
- 0 comments
This is article 7 of Practical Lean Finance. New here? Start with Article 1: SIPOC. Coming from the last article? Article 6: Eight Wastes showed you where close hours disappear. This one shows you why they keep disappearing.
If you think treating symptoms is the same as solving the root cause, you'd be a terrible doctor.
But that's exactly what most close teams do.
You measure the waste. You point at a task and say: that's 4 hours of overproduction, that's rework, that's a scheduling gap. And then the instinct kicks in. Kill the report nobody reads. Automate the manual step. Redesign the template.
That's changing the brake pad without checking the caliper. The pad is the visible failure. The caliper is the reason it wore out. Replace the pad, skip the caliper, and you're back in the shop in six months with the same wear on the same wheel.
I've watched close teams do this for twelve years. They identify waste. They attack it. The waste comes back, sometimes in the same task, sometimes somewhere new. Because the structural condition that created the waste was never identified.
That report nobody reads? It exists because three departments each build their own version of the same data. There's no single source of truth. No one ever mapped who needs what information, when, and in what format. Kill the report and the underlying problem, no data governance, no distribution design, is still there. It will produce a new workaround by next quarter.
The waste label is the X-ray. Root cause analysis is the diagnosis. Most organizations stop at the X-ray and go straight to surgery. They skip the part that matters.
By the end of this article, you'll have a simple sequence: confirm the facts, run a 5-Whys chain, avoid the three common traps, classify the root cause in a finance-close fishbone, and route the fix to the right owner.
Your Brain Makes It Worse
There's a second trap, and it's built into how your brain works.
Every time a close task breaks, your first instinct is to look at who was responsible. The analyst. The Procurement team. The person. Social psychologist Lee Ross identified this in 1977: the fundamental attribution error. When we observe someone else's behavior, we overestimate the role of their character and underestimate the role of their circumstances. When we explain our own failures, we do the opposite. We point to the system, the pressure, the missing information.
Applied to the close: when your data is late, you blame Procurement. When your report is late, you blame the workload.
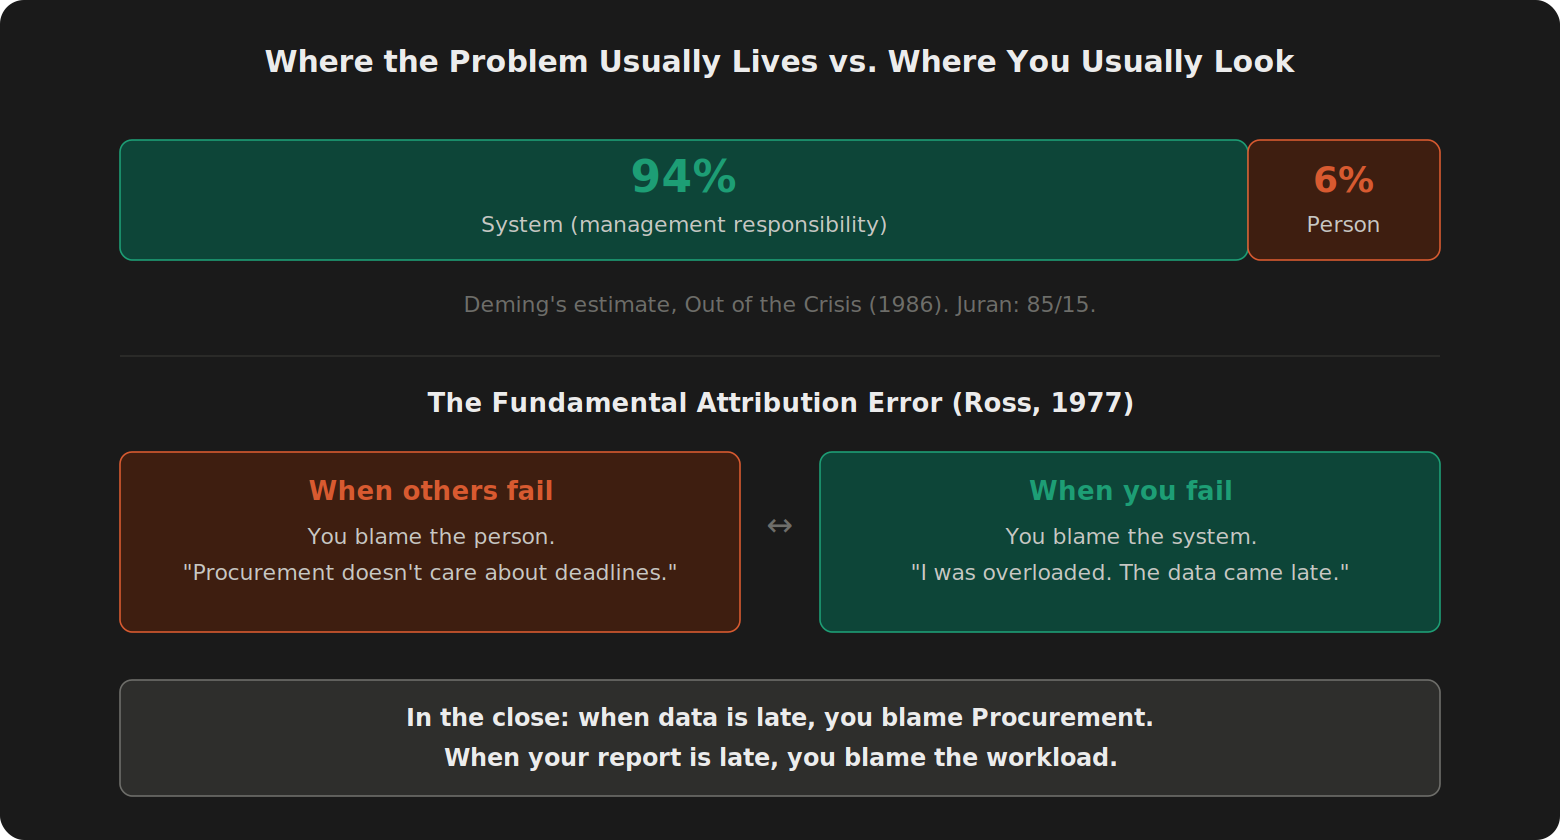
Deming made a related point from the opposite direction. In Out of the Crisis, he estimated that most problems and most possibilities for improvement belong to the system, which management is responsible for. He put the split at roughly 94/6. Juran made a related quality-management point through the Pareto principle: a small number of causes often explain a large share of the problem. The exact ratios are less important than the direction: when something goes wrong, the structural conditions that made the failure likely usually deserve more attention than the person who happened to be in the seat.
A study of root cause analysis at Hong Kong public hospitals showed what happens when this bias goes unchecked inside formal investigations. Of 760 recommendations produced after serious incident reviews, 82% were classified as "weak." The most common recommendation, at 61% of all actions: re-educate the involved staff and share the incident in a department meeting (Kwok, Mah & Pang, 2020). The investigators had sophisticated tools. They still defaulted to the person.
Now look at your close. Something goes wrong. The close lead identifies what happened and addresses the person who did it. Sends a reminder. Schedules a meeting. Requests retraining. Next month, same problem. The relationship gets worse. Nothing changes.
The waste measurement tells you what's broken. The attribution error tells you who your brain wants to blame. Neither one tells you why the problem exists. For that, you need to go deeper. Toyota built a method for exactly this.
Five Levels Deep
The 5-Whys technique comes from the Toyota Production System. Taiichi Ohno described it as the basis of Toyota's scientific approach to problem-solving (Ohno, 1988). The method is exactly what it sounds like: ask "why" five times, each time directing the question at the answer you just received.
The number five is a guideline. Some root causes surface at the third level. Others take six or seven. The principle is to keep going until the answers stop revealing new information and start circling back to the same structural gap.
One warning before you start. Do not run 5-Whys from memory in a meeting room. First confirm the facts: which file was late, which line items were missing, what deadline was communicated, what the system showed, and who actually owned the input. Otherwise, 5-Whys becomes five guesses. The chain is only as good as the evidence underneath it.
A second warning: 5-Whys is not magic. It can oversimplify complex problems if you force everything into one straight line (Card, 2017). For recurring close issues, use it as a practical starting chain, not as proof that only one cause exists. If the chain branches, note the branches. The fishbone later helps you classify the primary cause for routing, while secondary causes stay in the notes.
Here's what it looks like on a real close task.
Task: Confirm which open POs, goods receipts, and service entries should be accrued, reversed, or investigated. The task overran by an hour. Procurement couldn't confirm all open items in time. Finance had to chase 40 line items individually.
That's the symptom. Now ask why.
Why was the open PO data late? The report had 200-plus lines and Procurement couldn't confirm accrual relevance for all items in time.
Why couldn't they confirm in time? There's no agreed deadline for when this data needs to reach Finance.
Why is there no deadline? Finance never formally requested one. The data has always been collected informally.
Why hasn't Finance formalized it? Nobody mapped the dependency. Procurement doesn't know the close depends on this data arriving by close Day 3.
Why doesn't Procurement know? There's no upstream agreement documenting the data requirement, the format, the deadline, and the owner.
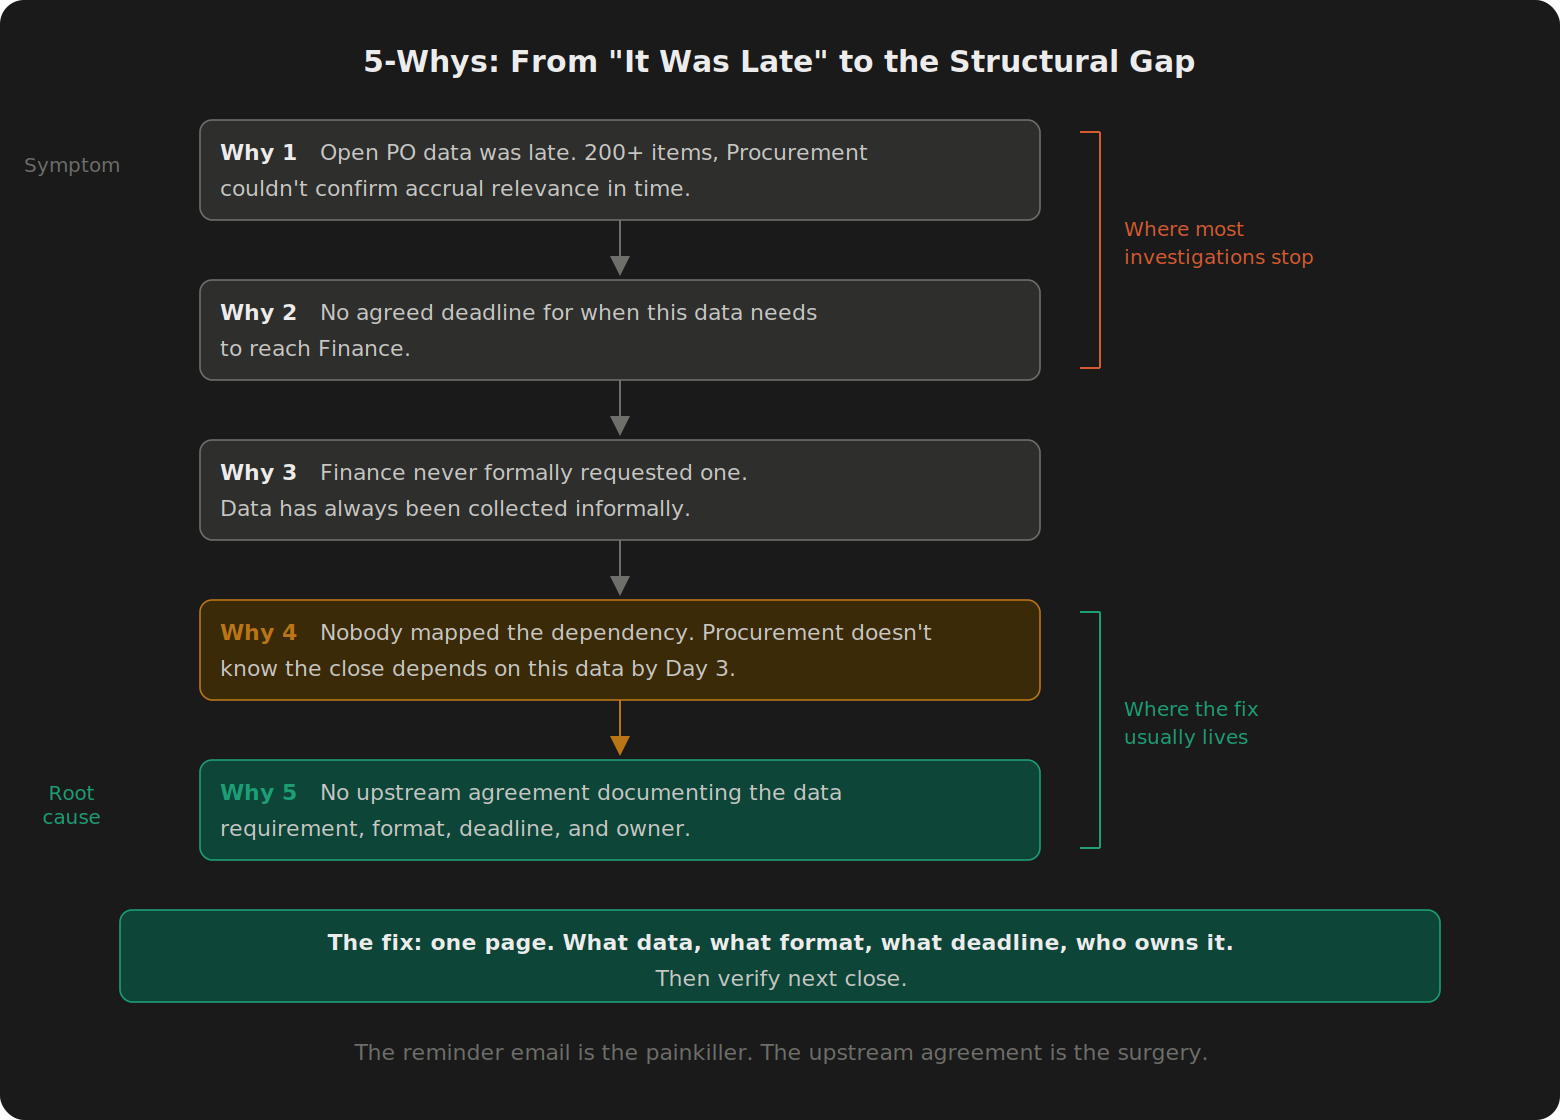
Five levels. The symptom was "open PO data was late." The root cause: a missing upstream agreement. Not a forgetful person. Not a lazy department. A structural gap. Nobody ever documented the dependency.
The fix writes itself. One page. What data, what format, what deadline, who owns it. One conversation with Procurement. The AP accrual now has a structural control. If it's still late next month, you have a different problem to investigate.
That's the difference between treating the symptom and treating the cause. The reminder email is the painkiller. The upstream agreement is the surgery.
When the Chain Goes Circular (and What to Do About It)
The AP accrual is a monthly problem. Here's a quarterly one from consolidation that shows what happens when the 5-Whys starts looping.
Task: Intercompany elimination entries. The consolidation accountant spends half a day every quarter reconciling IC balances that don't match between entities. Different amounts, different entity pairs, every quarter. The team treats each mismatch as a separate incident. Emails go out, corrections get posted, and three months later the same pattern repeats.
First attempt at the chain:
Why don't IC balances match? Entities post IC transactions at different times during the period.
Why do they post at different times? Each entity runs its own close schedule.
Why do they have separate schedules? They operate in different time zones and reporting cycles.
Why does that cause mismatches? Because consolidation happens on a fixed date and some entities haven't finalized their IC entries yet.
Stop. Read that chain again. Why 4 restates the original problem. We went from "balances don't match" through scheduling, time zones, and reporting cycles, and landed right back at "the timing doesn't align." Four levels deep, zero new information. The chain stayed in the same domain the whole way: scheduling logistics.
That's the circular trap. Time to back up and take a different branch at Why 2.
Why don't IC balances match? Entities post IC transactions at different times during the period.
Why does timing cause mismatches instead of just late entries? Because there's no automated IC matching. The consolidation accountant reconciles manually by pulling each entity's IC sub-ledger into a spreadsheet and comparing line by line. A posting date difference of two days creates a line item that looks like a mismatch even when both sides will eventually agree.
Why is there no automated matching? The ERP has an IC reconciliation module, but it was never configured. When the system was implemented, IC volumes were low enough that manual matching worked. Volume tripled since then.
Why wasn't the module configured when volume grew? Nobody owns IC process design at the group level. The consolidation accountant inherited the manual process and has been patching it quarter by quarter.
Root cause: unconfigured ERP module combined with missing process ownership. The fix is a system configuration project, not an upstream SLA. Turn on the IC matching module, set matching tolerances, configure the cutoff rules. Much of the manual line-by-line reconciliation disappears, provided the matching rules, tolerances, and cutoff logic are configured properly. The quarterly half-day can become a shorter exception review.
Different root cause category from the PO example. That one was Upstream Dependencies. This one is Data & Systems. Different category, different fix, different person to talk to. The PO problem needed a conversation with Procurement. The IC problem needs a conversation with IT and whoever owns ERP configuration.
Three Ways the Chain Breaks
The 5-Whys is simple. That's both its strength and its risk. There are three ways close teams consistently get it wrong.
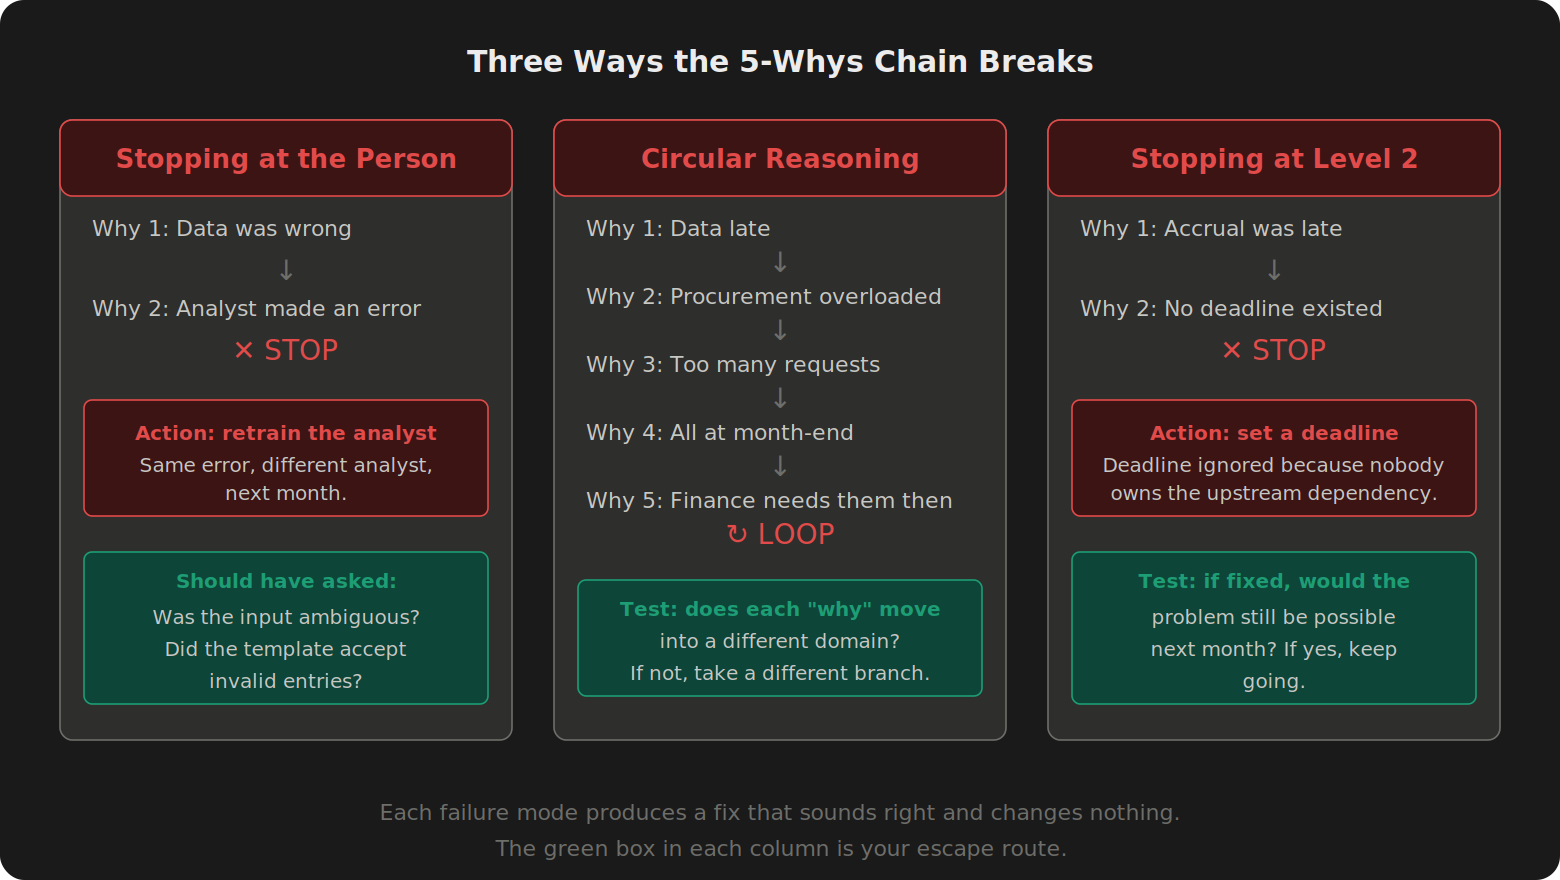
Stopping at the person. "The analyst made an error" is not a root cause. It's a description of a human action. Keep going. Was the input ambiguous? Was the template designed to accept invalid entries? Was there no validation step? Attributing root causes to individuals is the fundamental attribution error playing out in your process improvement. It's also organizationally corrosive. The next time something goes wrong, the person who spotted it won't say anything because last time the investigation ended at their desk.
Circular reasoning. This is the failure mode that makes close leads give up on the whole method. "Why is the data late? Procurement is overloaded. Why? Too many data requests. Why? They all come at month-end. Why? Because that's when Finance needs them." The chain circles back to the original problem. You've spent ten minutes and arrived exactly where you started. The test: does each successive "why" move the analysis into a different domain? From Finance's task to Procurement's capacity to the organizational scheduling decision to the structural design of the close calendar? If the chain stays in the same domain after three levels, it's probably circular. Back up and take a different branch.
Stopping at level 2. The most common failure. The first two levels of "why" produce a factual description of what happened. "The data was late." "There was no deadline." Those are proximate causes. A genuine root cause is a structural condition whose removal prevents the problem from recurring. The test: if the root cause were fixed, would the problem still be possible next month? If yes, you haven't gone deep enough.
Barbara Key's 2019 study at Western Kentucky University tested 5-Whys support factors across problem-solving teams at a North American electrical repair company. The presence of a trained facilitator had a significant effect on solution quality (Key, 2019). The practical lesson for finance is simple: the facilitator's value is often not technical expertise. It's the discipline to ask one more "why" when the team wants to stop.
You probably don't have a trained facilitator. But you can be your own. When the answer sounds complete and you feel like stopping, that's the signal to push for one more level.
Painkillers vs. Surgery
In Lean problem-solving, the distinction between shallow and deep fixes has formal names.
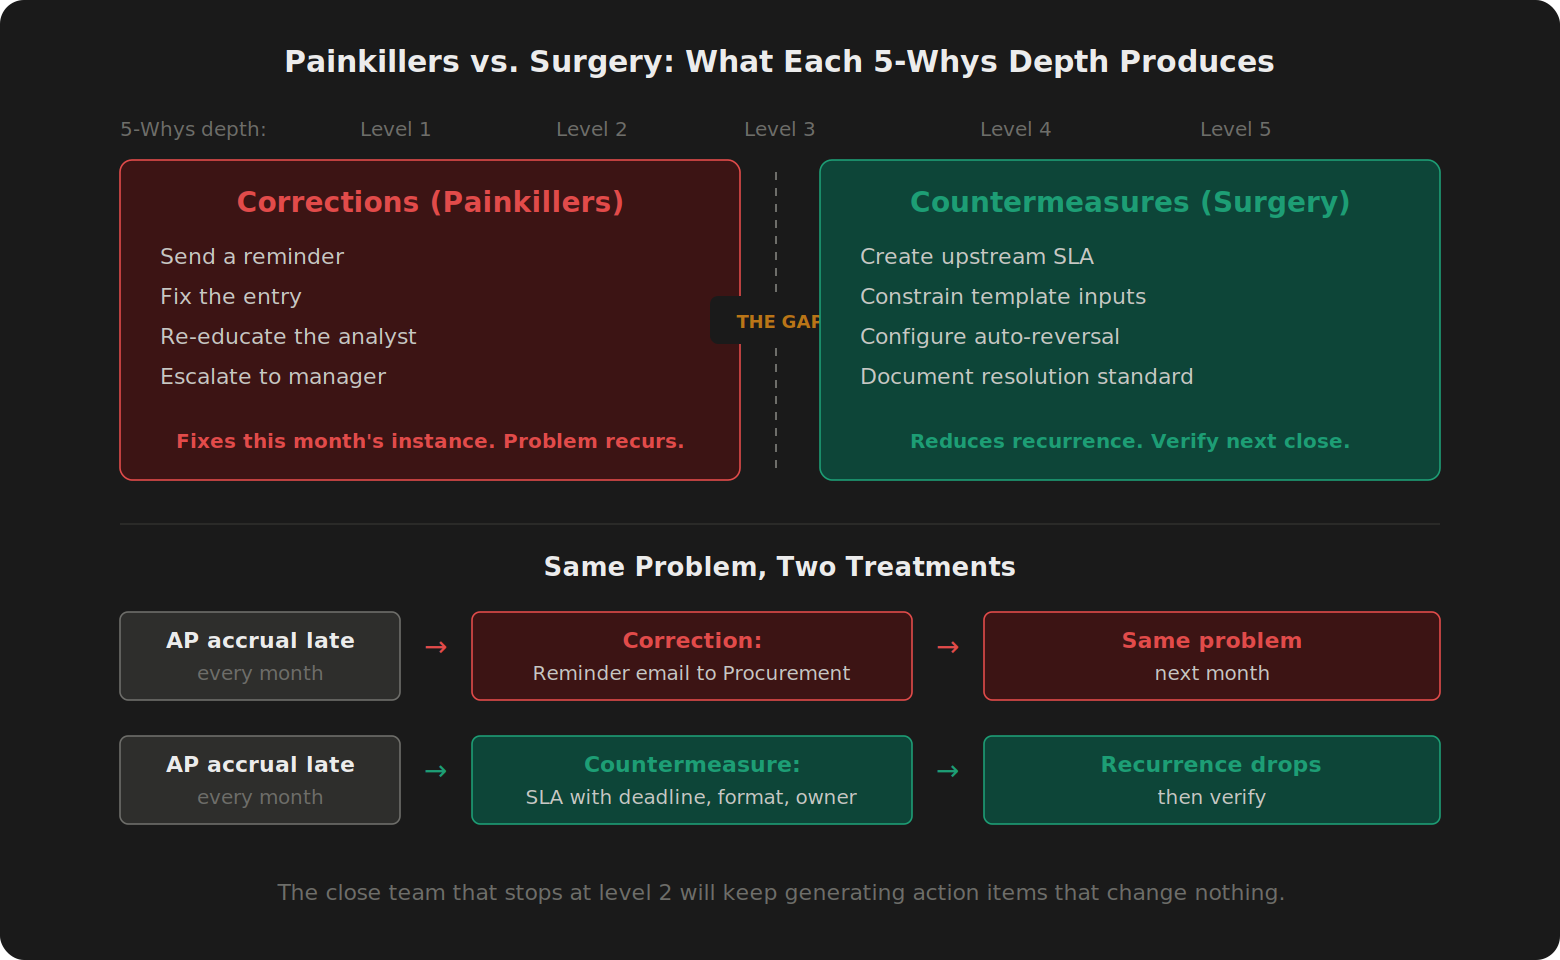
A correction addresses the immediate instance. The data was late this month; you call Procurement and get the data. The journal entry had an error; the analyst fixes it. Corrections restore the current close to a workable state. They don't prevent recurrence. They're the painkiller.
A countermeasure addresses the systemic condition that allowed the problem to occur. The data is late every month because no agreement documents the deadline; the countermeasure is to create the agreement. The journal entry has errors because the template accepts free-text account codes; the countermeasure is to constrain the input to a validated dropdown. That's the surgery. A countermeasure is not a guarantee that the problem is gone forever. It's a structural change you expect to reduce recurrence. You verify it in the next close. If the problem returns, you have a new fact to investigate.
In practice, the first two levels of "why" usually produce corrections. Deeper levels are more likely to reveal countermeasures. It's not a rigid rule, but the pattern holds: a close team that stops at level 2 will generate action items that look productive in the post-mortem and change nothing by next close.
The hospital study confirms the pattern at scale. When 82% of formal investigation recommendations target individual re-education, the problem isn't that people don't care about root causes. It's that without structural support, whether a facilitator, a forced method, or a categorization tool, human brains default to the person-level explanation. And person-level explanations produce person-level fixes. Reminders. Retraining. Awareness sessions.
Painkillers, all of them. The task breaks again next month.
Who Gets to Ask "Why" Five Times?
Here's the part the textbooks skip.
In manufacturing, the 5-Whys has institutional backing. It's embedded in the quality system. When a production defect occurs, there's an expectation that someone will trace it to the root. The method has organizational legitimacy.
In finance close operations, asking "why" five times about a handoff with Sales or Procurement can be career-limiting. If the Staff Accountant calls the Procurement Manager and asks why their data is late, the first "why" works. The second gets a polite explanation. The third gets pushback. The fourth gets escalated to your boss as a complaint about your attitude.
The method's effectiveness depends on who's wielding it. A controller asking "why" carries different weight than a staff accountant asking "why." A CFO asking "why" changes the room entirely.
This isn't a weakness of the method. It's a design consideration. If your fishbone keeps showing upstream dependencies as the primary category, the close lead can identify the pattern, but the fix requires someone with cross-functional authority to have the conversation. The analysis stays with the practitioner. The action goes to the person with the standing to negotiate the agreement.
Know this before you start. You'll find root causes you can't fix alone. That's not failure. That's the method working. Document the finding, quantify the recurring cost, and hand it to someone who can act on it. The fishbone distribution is the business case.
Classify What You Find: The Fishbone
Knowing the root cause of one task is useful. Seeing a pattern across twenty tasks changes the conversation entirely.
The fishbone diagram (also called Ishikawa, after Kaoru Ishikawa who developed it at the Kawasaki shipyards in the 1960s) is a categorization tool. In manufacturing, it uses six branches known as the 6Ms: Man, Machine, Method, Material, Measurement, and Environment. Each branch represents a domain where root causes might originate.
For close operations, some of the manufacturing categories translate directly and others need reworking. "Machine" in modern fishbone variants includes software, but in a finance close the scope is broader: ERP configuration, interfaces, report logic, mapping tables, templates, and workflow tools. I grouped all of that under Data & Systems and adapted the fishbone to five categories specific to the close:
People & Ownership. A gap in accountability, skill, or role definition. Sometimes this is the genuine root cause: no backup was trained, role assignment was unclear, or someone lacked the skill and the training system didn't catch it. The category is real. The risk is that it becomes the default.
Process & Sequence. The order, timing, or design of the close steps.
Data & Systems. Data quality, system configuration, or interfaces that feed the task. Wrong account mappings, missing auto-reversals, broken integrations. This is where the manufacturing "Machine" category lives in a finance context.
Upstream Dependencies. The root cause crosses a department boundary. The fix requires an agreement with a team Finance doesn't control.
Standards & Documentation. A missing or inadequate standard. No policy defines the expected format, deadline, or resolution timeline.
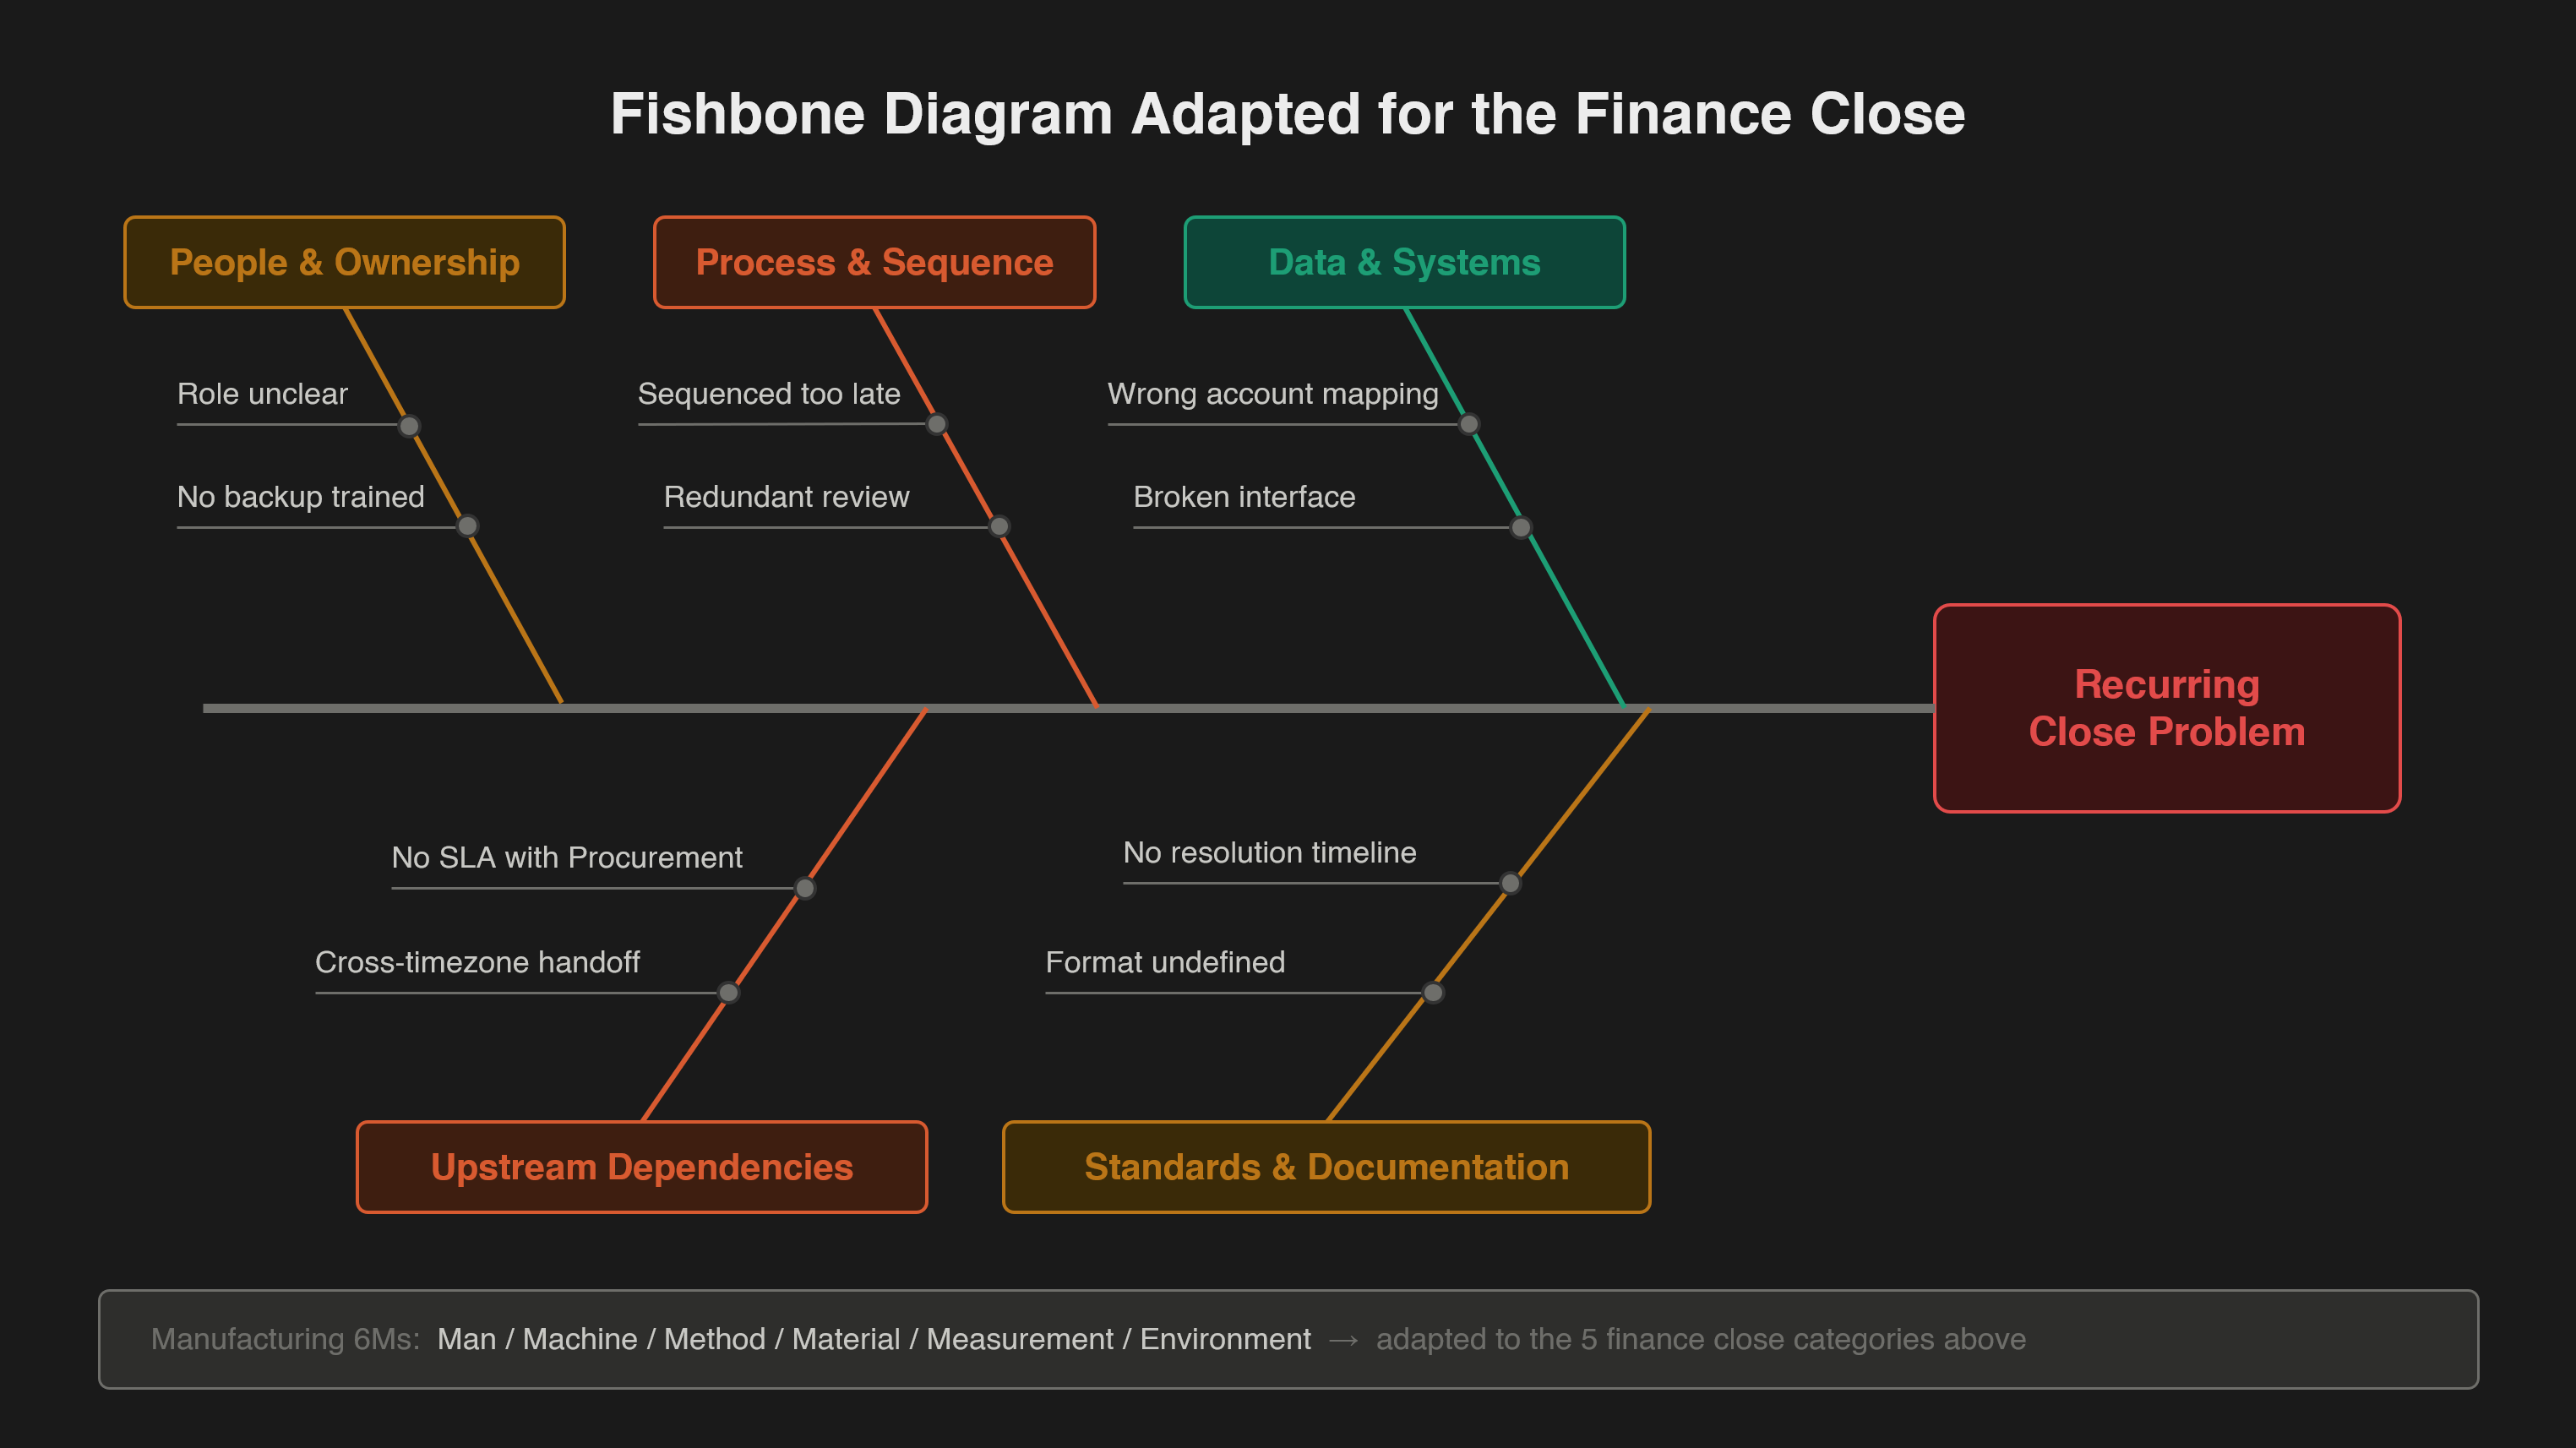
For the improvement dashboard, I assign one primary category per recurring task. Secondary contributing factors go in the notes. That forced primary choice is not meant to deny complexity. In a standard fishbone brainstorm, causes can appear across multiple branches, and that's fine for diagnosis. But when you're tracking recurring close problems and routing ownership, checking three boxes means nobody owns the outcome. The forced single-category choice makes one person or one team accountable for the structural fix. It's a routing convention, not a theoretical claim about how many causes exist.
What the Pattern Tells You (and Who to Talk To)
In the manufacturing close I mapped, I ran root cause analysis across 54 tasks that had recurring overruns out of the 127-task close. The fishbone distribution:
Data & Systems: 24. Upstream Dependencies: 18. Standards & Documentation: 6. People & Ownership: 5. Process & Sequence: 1.
Data and Dependencies together: 42 out of 54. Seventy-eight percent.
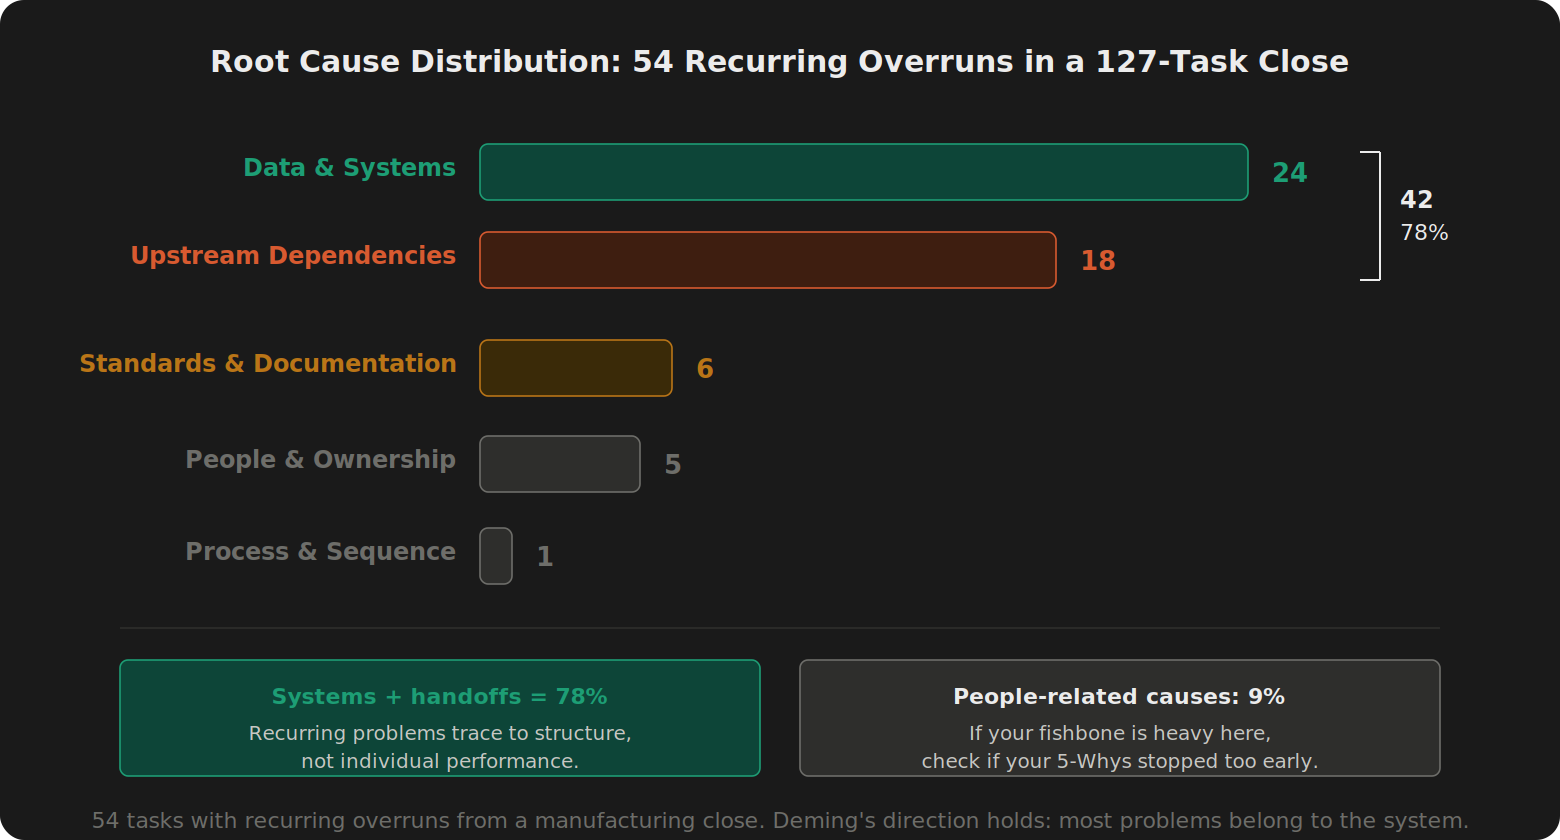
Deming estimated that most problems belong to the system. Juran said something similar. The exact ratios vary by context. But in this finance close, the direction is the same: the majority of recurring problems trace to structural conditions, not individual performance.
That pattern isn't coincidental. It reflects the close as a process type.
The close operates across department boundaries by design. Financial statements consolidate information from every function. Revenue data from Sales. COGS from Operations. Accruals from Procurement. Each dependency is a cross-functional handoff and a potential failure point. That's why upstream dependencies show up.
The close also depends on data infrastructure. Account mappings, auto-reversal configurations, consolidation hierarchies, intercompany elimination rules. When any of these are wrong, they produce the same error every month until someone corrects the configuration. That's why Data & Systems dominates.
In recurring close problems, purely individual errors often vary from month to month. But system and handoff root causes tend to repeat in the same task, same phase, every cycle. Over time, the fishbone accumulates more entries in the structural categories because those problems persist until they're fixed. If a "people" issue keeps recurring, it's usually worth asking whether the deeper cause is role design, training design, workload, backup coverage, or unclear standards.
If your fishbone is heavily weighted toward People & Ownership, check whether the 5-Whys stopped too early. Sometimes it's genuinely an ownership or capability gap. But often, the deeper cause is an unclear standard, missing backup design, or broken handoff that no one traced past the person in the seat.
Once enough tasks are classified, the fishbone becomes a Pareto view. You stop asking "what went wrong this month?" and start asking "which few cause categories explain most of the recurring pain?" That's Juran's "vital few" applied to your close: concentrate improvement effort where the hours actually sit.
The distribution also tells you who to talk to. If Dependencies leads your dashboard, the fix is upstream agreements. That's a controller-level conversation with other department heads, and it's the subject of the next article. If Data & Systems leads, the fix is an ERP or IT conversation about configuration, mappings, and interfaces. If Standards leads, the fix is documentation you can write yourself. The fishbone doesn't just categorize the problem. It routes the solution.
One more thing. If Data & Systems keeps appearing as the primary category, ask whether the root cause is in your close process or in your ERP configuration. Wrong account mappings, missing auto-reversals, broken interfaces. Those are ERP problems dressed as close problems. Fixing the close won't help if the ERP is misconfigured.
FAQ
How long does a single 5-Whys analysis take?
Fifteen to twenty minutes if you've already confirmed the facts. The time cost isn't in the questioning. It's in the fact-gathering beforehand. You need to know which file was late, what the system showed, who owned the input, and what deadline was communicated. Running 5-Whys without that preparation produces five guesses, not five answers. Budget thirty minutes total per task the first time: ten for fact-gathering, twenty for the chain. It gets faster after the third or fourth one because you learn which facts to collect upfront.
Can you use 5-Whys on a task that only failed once?
You can, but ask yourself why. A one-time failure might have a one-time cause: someone was sick, the system was down for maintenance, a vendor missed a delivery. The 5-Whys pays off on recurring problems because the root cause is generating cost every cycle. If the task fails again next month, then it's a pattern worth investigating. Most close teams have the opposite problem. They have fifteen recurring issues and time to investigate three. Spending thirty minutes on a one-off while ignoring a problem that has burned hours every month for a year is its own kind of waste.
What if the root cause is in another department and they won't cooperate?
This is the most common objection I hear. And it's why the "Who Gets to Ask Why" section exists. The analysis and the action are separate deliverables. You do the 5-Whys. You classify the root cause. You quantify the recurring cost. Then you hand the finding, with the cost attached, to someone who has the authority to negotiate. The fishbone distribution is the business case. If 78% of your recurring overruns trace to systems and upstream handoffs, that number changes the conversation with the CFO. A staff accountant can't force an SLA with Procurement. A controller armed with data can.
Is the fishbone overkill for a small close with fewer than 50 tasks?
The opposite. A 50-task close might have ten recurring problems. You don't need a formal dashboard. A spreadsheet with the task name, the 5-Whys chain, and the primary fishbone category is enough. The pattern will still emerge. In my experience, smaller closes often make dependencies and missing standards more visible because there are fewer tasks and fewer places for the root cause to hide.
Try This Before Next Close
Pick the close task that has broken 3 or more months in a row. The one that shows up in every post-mortem. The one where the fix has never stuck.
Write the 5-Whys chain. Start with what happened. Ask why. Write the answer. Ask why again. If you reach a person's name before level 4, keep going. The person is rarely the root cause. Something in the system usually made that outcome likely.
One rule: base every answer on a fact, not a guess. "The data was late" is verifiable. "Procurement doesn't care" is an attribution. If you can't verify an answer, go confirm it before writing the next level.
When you reach a structural answer, a missing agreement, an absent standard, a misconfigured system, ask: if I fixed this, would the problem still be possible next month? If no, you've found a countermeasure. If yes, you're still at a correction. Push for one more level.
One task won't transform your close. But it will show you the difference between treating the symptom and treating the cause. And it might explain why that same fix has never stuck.
What's the one close task your team has tried to fix more than once, where the fix never lasted?
The series so far: SIPOC mapped the close. Value classification sorted what to protect, simplify, and eliminate. Swimlanes made the handoffs visible. Critical path found the tasks with zero margin. Resource leveling showed where people were overloaded. The eight wastes showed where time hides and why the wrong fix category guarantees the problem comes back. This article gave you a method to find the actual cause instead of treating the symptom.
Next: 34.5% of your close hours depend on people who don't report to you. How do you map those upstream dependencies and build a case for fixing them?
If you want the spreadsheet version, including the 5-Whys log, fishbone category tracker, recurring-task dashboard, and improvement plan, it's included in Month-End Close Optimization: Run Your Close Like a System, Not a Fire Drill on GoFast.Finance.
This article originally appeared in the Practical Lean Finance newsletter on LinkedIn.
Sources
Deming, W. E. (1986). Out of the Crisis. MIT Press. "I should estimate that in my experience most troubles and most possibilities for improvement add up to the proportions something like this: 94% belongs to the system (responsibility of management), 6% special." Page 315.
Ohno, T. (1988). Toyota Production System: Beyond Large-Scale Production. Productivity Press. Origin of the 5-Whys technique.
Ishikawa, K. (1976). Guide to Quality Control. Asian Productivity Organization. Origin of the fishbone (Ishikawa) cause-and-effect diagram at the Kawasaki shipyards.
Ross, L. (1977). "The intuitive psychologist and his shortcomings: Distortions in the attribution process." Advances in Experimental Social Psychology, 10, 173–220. Identification of the fundamental attribution error.
Juran, J. M. (1951). Quality Control Handbook. McGraw-Hill. Pareto principle formalized for quality management: the "vital few and the trivial many." Applied here as the basis for fishbone-driven prioritization.
Key, B. A. (2019). "Five Whys Root Cause System Effectiveness: A Two Factor Quantitative Review." Masters Theses, Western Kentucky University, Paper 3098. Trained facilitators had significant effect on solution quality.
Kwok, Y. T. A., Mah, A. P. Y. & Pang, K. M. C. (2020). "Our first review: an evaluation of effectiveness of root cause analysis recommendations in Hong Kong public hospitals." BMC Health Services Research, 20, 507. Of 760 recommendations, 82% classified as weak; 61% were re-education or awareness sessions targeting individuals.
Rother, M. (2010). Toyota Kata. McGraw-Hill. Correction vs. countermeasure distinction in Toyota's improvement methodology.
Card, A. J. (2017). "The problem with '5 whys'." BMJ Quality & Safety, 26(8), 671-677. Caution that 5-Whys can oversimplify complex systems if treated as a complete RCA method rather than a practical diagnostic starting point.