- Apr 26
You're Fixing the Wrong Problem. Here's How to Tell.
- Arnaud Lemaire
- Accounting & Auditing
- 0 comments
The eight Lean wastes applied to month-end close work, and why matching the fix to the cause matters more than the fix itself.
This is the sixth article in the Practical Lean Finance series, where I apply Lean Six Sigma tools to real finance processes. If you're joining here, the previous article on resource leveling showed where people are overloaded in the close. This one answers a different question: where does the time actually go?
Your Staff Accountant posts AP accruals late every month. You send them to Excel training. They come back faster at Excel. The accrual is still late.
Procurement's PO data arrives two days after you need it. A cross-functional handoff. No amount of Excel skill inside Finance fixes a gap that lives outside your department.
I've watched this play out for twelve years. A close task breaks every month. Someone identifies a fix. The fix targets the person doing the task. The task keeps breaking. Because the cause was in the process design, not the execution.
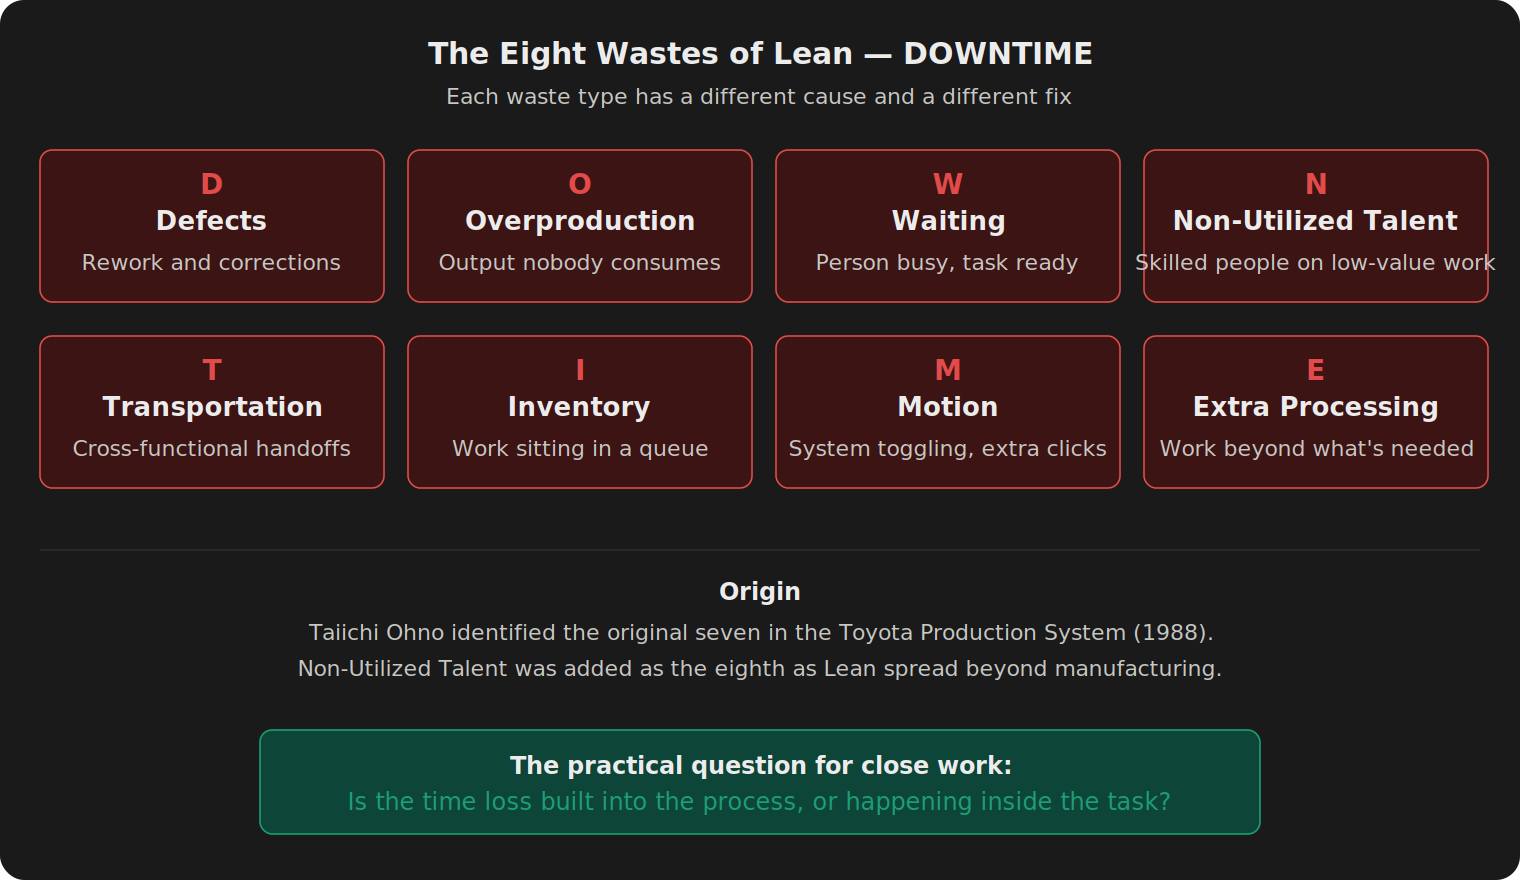
Lean has a framework for sorting this out. Eight types of waste, each with a different cause and a different fix. But the practical question for close work comes down to one thing: is the time loss built into the process, or happening inside the task? Get that wrong and you'll spend months on a solution that can't work.
The Eight Wastes: DOWNTIME
Over the last five articles, we mapped a 127-task manufacturing close with SIPOC, classified each task, sequenced it into swimlanes, found the critical path, and leveled the workload across roles. All of that tells you what happens and when. None of it tells you where the time actually goes.
Taiichi Ohno identified the original seven categories of waste in the Toyota Production System. As Lean spread beyond manufacturing, many practitioners added an eighth: non-utilized talent. Together the eight are often remembered by the mnemonic DOWNTIME: Defects, Overproduction, Waiting, Non-utilized talent, Transportation, Inventory, Motion, Extra processing (often called Overprocessing).
Eight types is a lot to hold in your head at once, especially when you're trying to decide what to do about a specific slow task. In practice, I sort them into two diagnostic families based on a simpler question: when does the waste happen?
Eight Types, Two Families
The split is straightforward. Some waste happens around the task, before the work can flow. Some happens inside the task, while someone is actively doing it. That distinction determines where the fix lives.
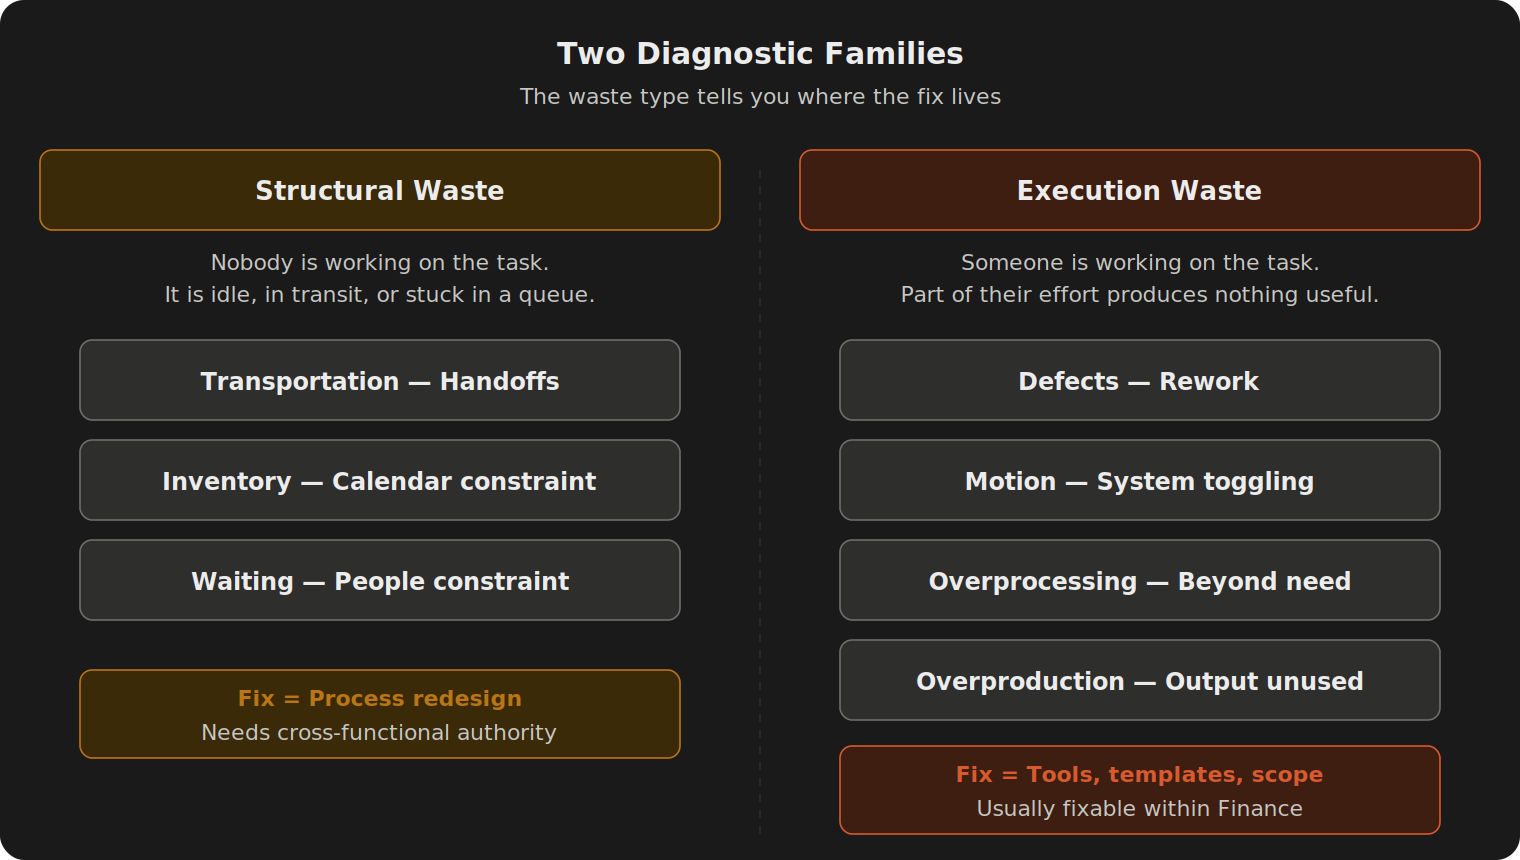
Structural waste happens around the task: handoffs, queues, timing gaps, and coordination loops that prevent the work from flowing cleanly. Three types fall here: Transportation, Inventory, and Waiting. Fixing them means changing the process, and that takes cross-functional authority because you need Operations, Procurement, or Legal to change how and when they deliver.
Execution waste happens inside the task while someone is actively performing the work. The person is at their desk, but part of their effort produces nothing useful. Four types: Defects, Motion, Overprocessing, and Overproduction. These are usually easier to attack inside Finance because the waste happens inside the work itself.
The eighth waste, non-utilized talent, cuts across both sides. It shows up when skilled finance people spend close hours on mechanical work that should have been simplified, automated, or moved closer to the source.
Let me walk through each one with a concrete close example.
Structural Waste: Transportation
Transportation is the time burned on cross-functional handoffs.
You need goods receipt confirmation from Operations. You send the request, wait for acknowledgment, receive data in the wrong format, follow up. An hour gone. The task itself takes twenty minutes once the data arrives.
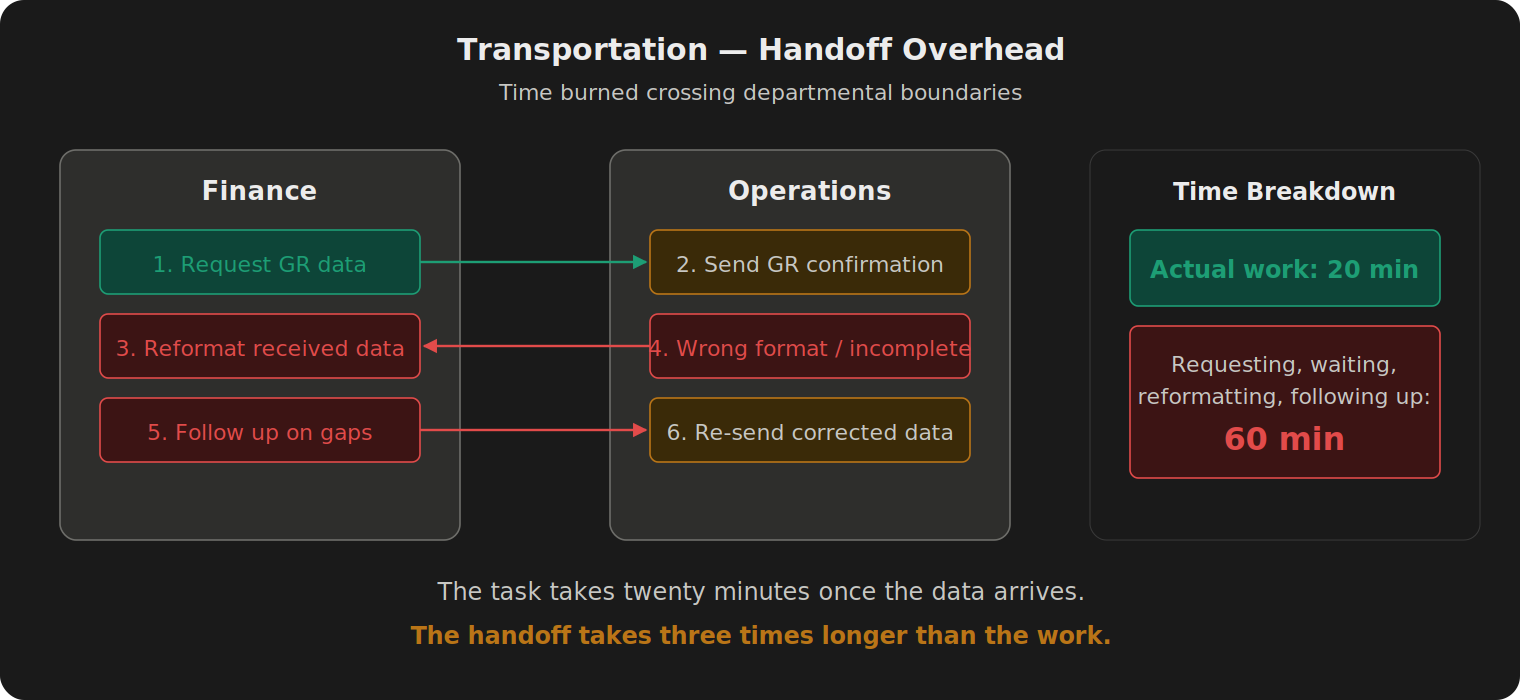
Every lane change on the swimlane from Article 3 carries this kind of overhead. And it compounds. In the pre-close and data collection phases of the manufacturing close I mapped, almost every consecutive task changed lanes. Cut-off confirmations, accrual data, expense submissions, inventory counts, intercompany confirmations. Each one is a request-wait-clarify-receive cycle.
The fix is never "be faster at following up." The fix is reducing the number of crossings. Pre-position data before the close window opens. Automate the transfer so it doesn't require a human on each side. Or restructure the sequence so related tasks stay in the same lane longer.
Structural Waste: Inventory
Inventory in manufacturing is work-in-progress sitting between machines. In close work, it's completed output sitting in a queue before the next step can start.
In the manufacturing close I mapped, Legal finished their prior task at hour 33. But the litigation update couldn't start before Day 4. The task sat idle for 30 hours. Not because anyone was slow. Because the scheduling window hadn't opened.
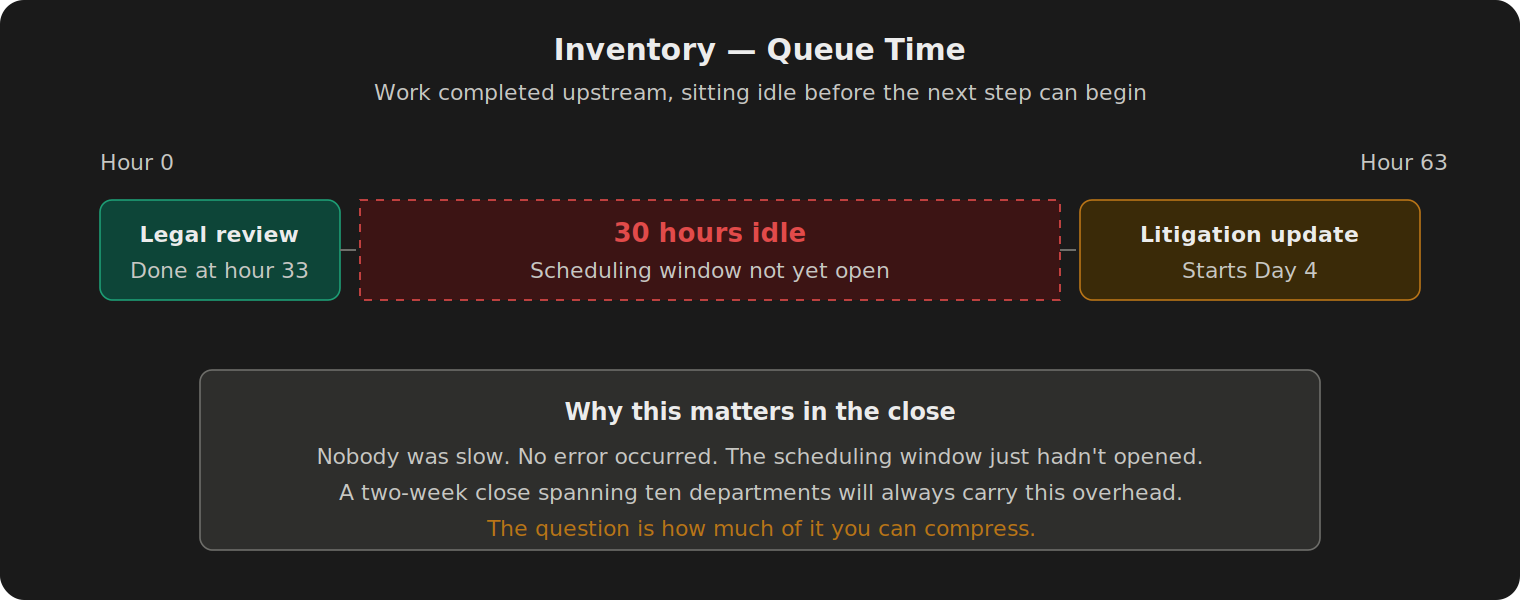
A close spanning two weeks and ten departments will always carry scheduling overhead. The question is how much of it you can compress. Some of it is unavoidable (the bank statement isn't available until the period ends). Some of it is organizational habit that nobody has questioned. "We always start intercompany on Day 3" might have had a reason once. It might not anymore.
Structural Waste: Waiting
Waiting is different from Inventory. Inventory is a calendar constraint: the scheduling window hasn't opened. Waiting is a people constraint: the window is open, the data is ready, but the person assigned is finishing something else.
This is the resource contention from the previous article, now with a cost label attached. The critical path method assumes every task starts the moment its inputs are ready. Reality doesn't work that way. Your Senior Accountant is still working on the FX revaluation when the intercompany reconciliation inputs land on their desk. The reconciliation sits there, ready, waiting for a person who is busy with something else.
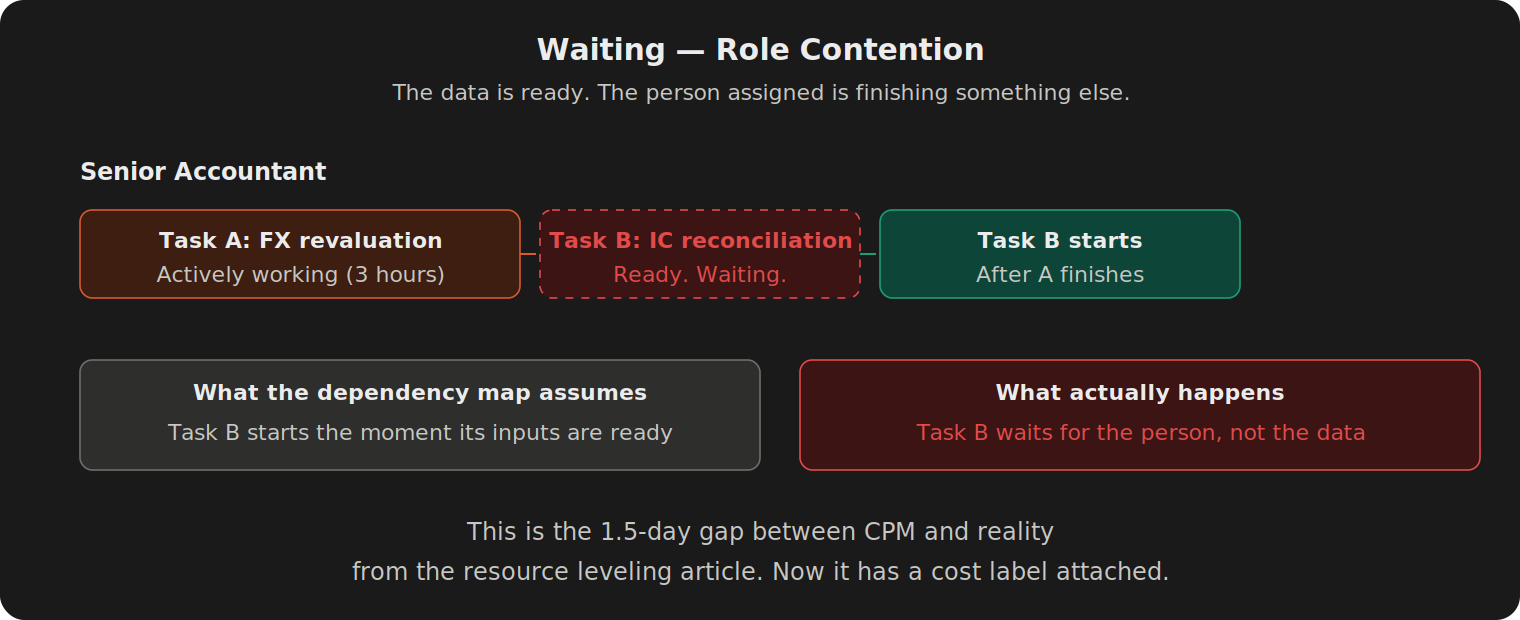
In the sample close, the gap between CPM's theoretical finish and the actual resource-constrained schedule was 1.5 business days. That gap is Waiting. Work sitting ready, not being worked, because a human is occupied elsewhere.
Execution Waste: Defects
Defects is rework. A journal entry fails review, someone spends thirty minutes fixing a misposting that should have been right the first time.
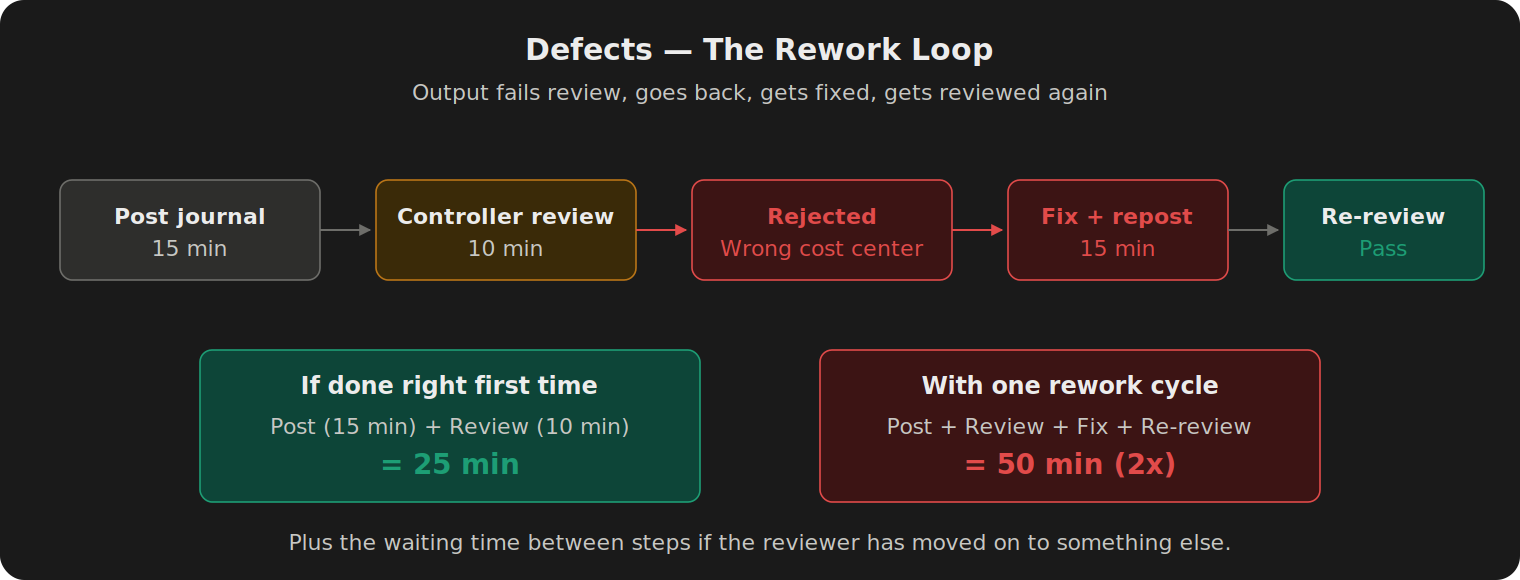
The visible cost is the time to fix the entry and re-review it. The hidden cost is the waiting time between steps. The controller has moved on to something else. They'll get to your re-review later. Maybe today. Maybe tomorrow morning. A 15-minute fix turns into a half-day delay because two people's schedules have to re-synchronize.
Defects have a compounding effect on the critical path that's easy to miss. Every rework cycle isn't one delay. It's two: the fix itself, and the queue time waiting for re-review.
Execution Waste: Motion
Motion is the effort spent finding and moving data rather than using it.
The consolidation accountant pulls intercompany balances from three separate ERP instances, reformats each export into the group template, reconciles the differences manually. Forty-five minutes of toggling between systems. The actual posting takes ten.
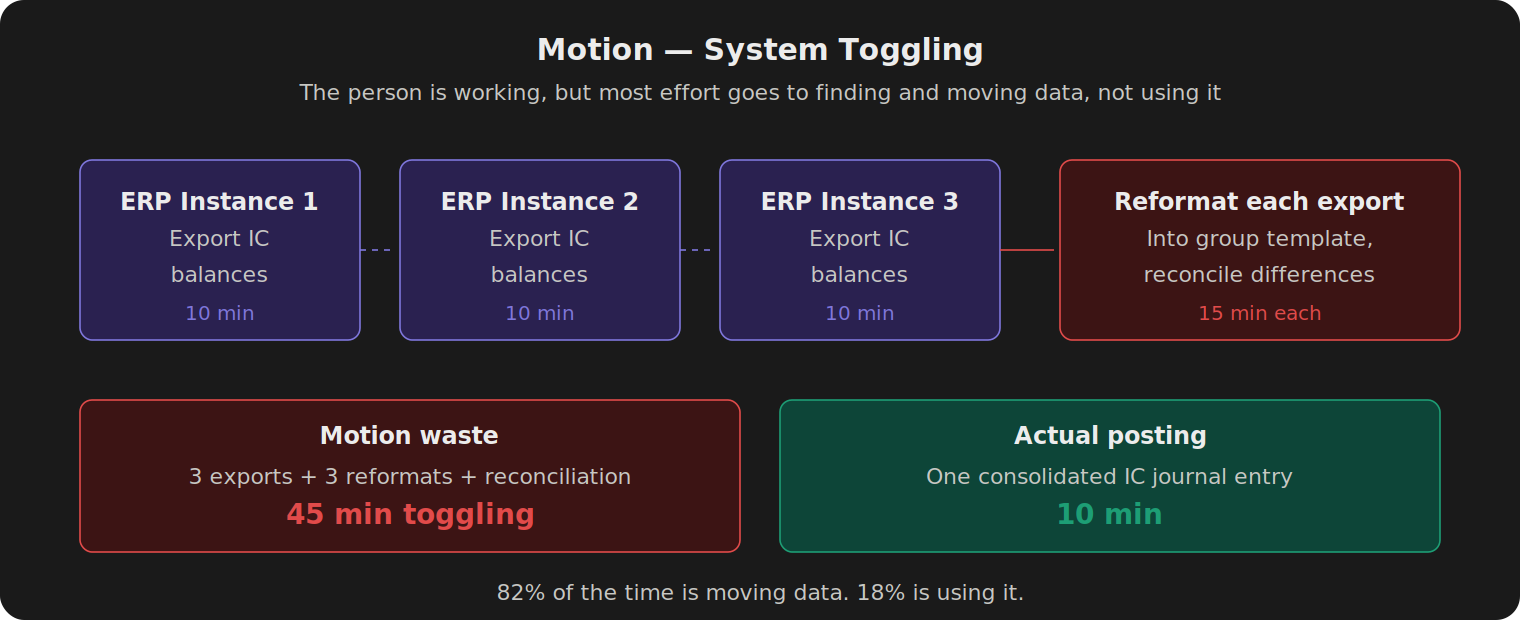
Motion waste is invisible on a task list because the task gets done. It shows up on time. Nobody flags it. But if you shadow the person doing it, you'll watch them switch between six browser tabs, three Excel files, and two ERP sessions for an hour to produce one journal entry. The actual financial judgment in that hour was about four minutes.
Execution Waste: Overprocessing
Overprocessing is work done to a higher standard, detail, or polish than the consumer actually requires.
Every month, the financial analyst takes the standard output from the reporting tool, copies it into Excel with custom headers, color-coded rows, and a specific sort order the controller prefers. The controller opens it at the start of the review meeting, glances at the top line, and moves to the discussion.
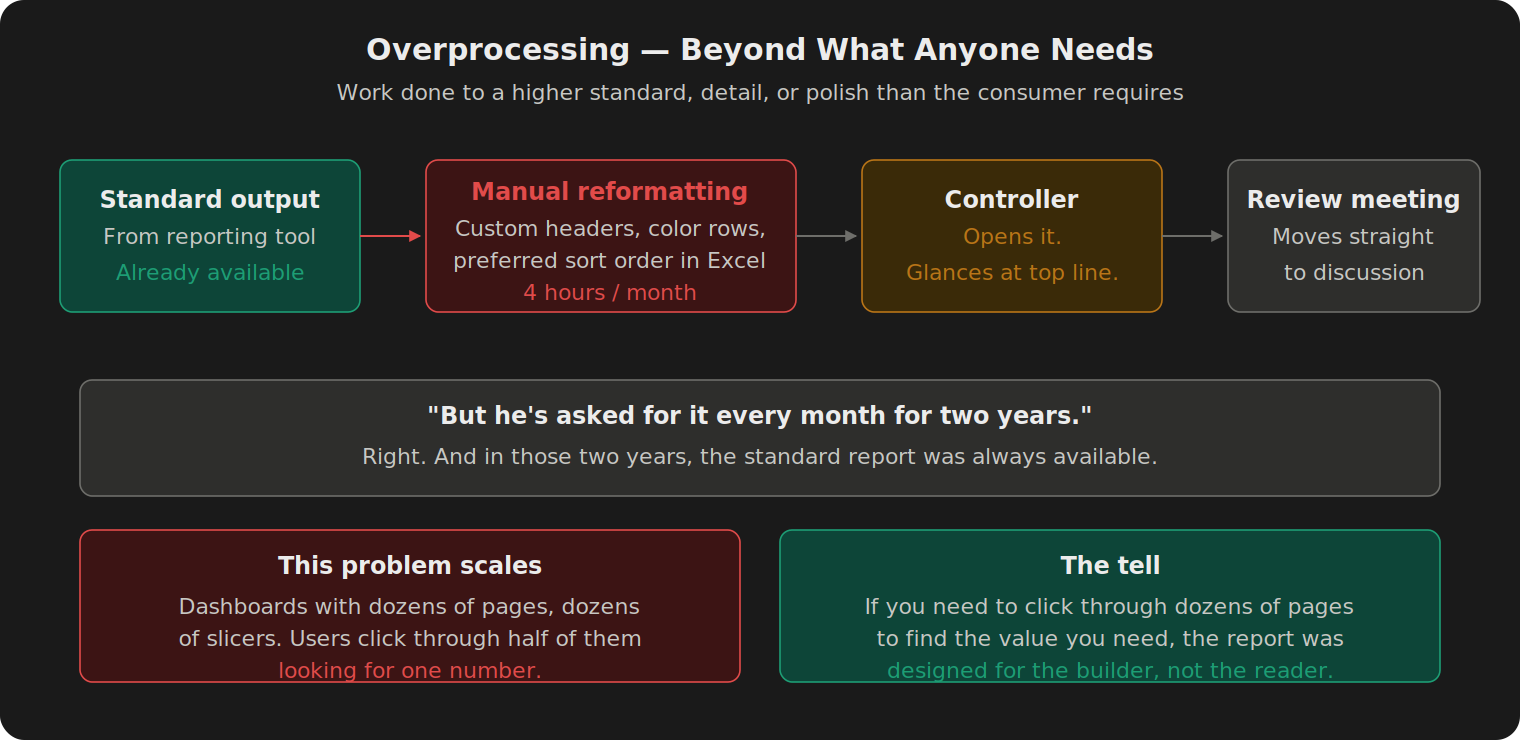
I used this exact example in a classification workshop once. The analyst pushed back immediately: "But he's asked for it every month for two years." Right. And in those two years, the standard report was always available. What the controller wanted was a familiar format. What the analyst gave him was four hours a month of habit maintenance dressed up as a deliverable.
This problem scales. I've seen BI environments with dashboards that have fifty slicers, thirty pages, and dozens of chart variants. The user clicks through half of them looking for the one number they care about. If you need to click through dozens of pages to find the value you need, the report was designed for the builder, not the reader.
That's the tell. The underlying need is real (the controller wants a clear view), but this specific task is the wrong way to meet it. A reporting tool configuration fix takes an afternoon. The recurring manual workaround costs four hours a month, twelve months a year, until someone retires.
Execution Waste: Overproduction
Overproduction is output nobody consumes. A second reconciliation of an immaterial account. Supporting detail the controller never opens. A report that refreshes every day but hasn't been opened in six months.
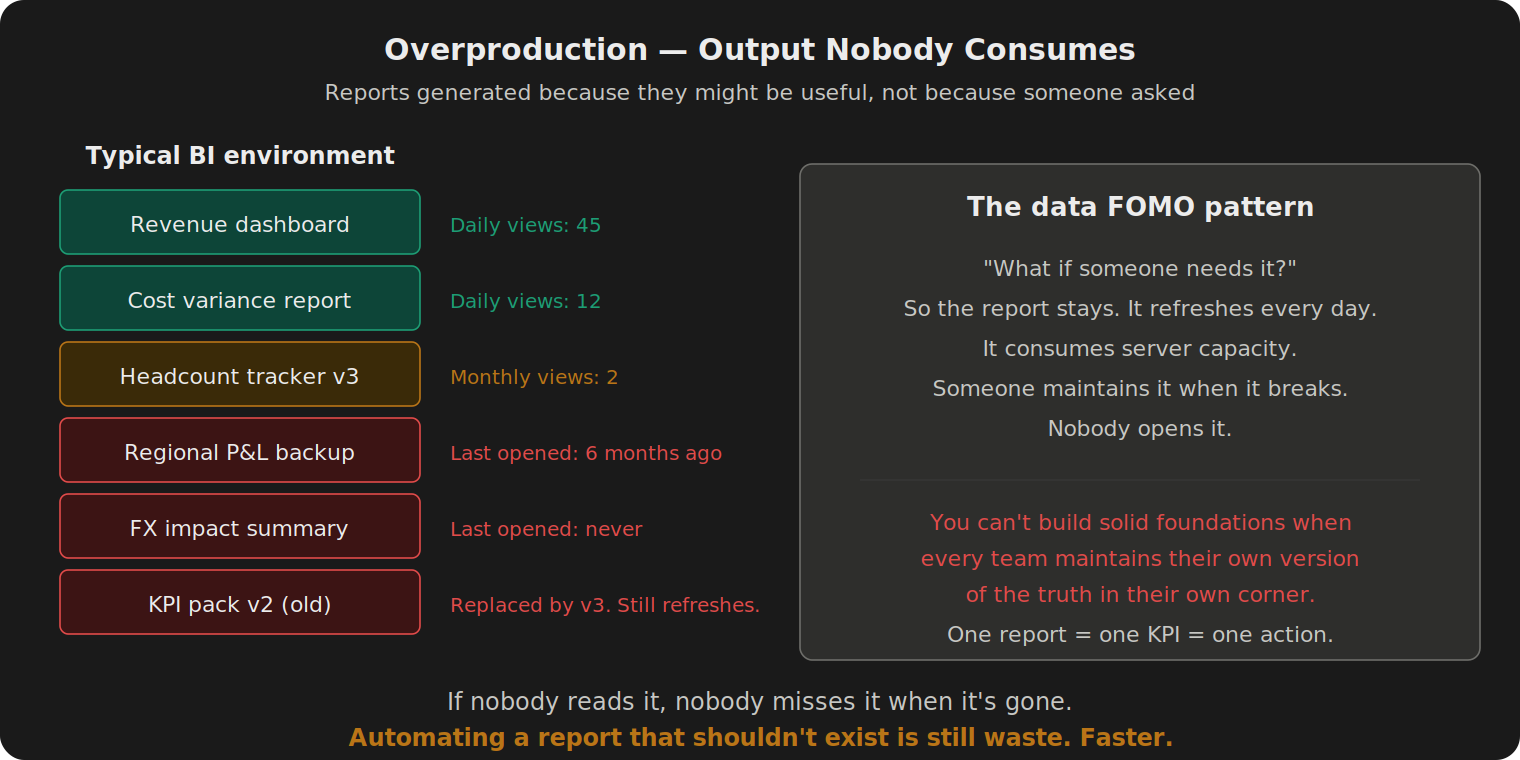
This is the most common waste I see in finance organizations and the least discussed. Walk into any mid-to-large company's BI environment and count the reports. Dozens of Power BI dashboards, Excel packs, and recurring email distributions that nobody reads. They exist because someone once asked "what if we need it?" and nobody ever went back to check.
The numbers back this up. Datalogz, an analytics governance firm, presented data at the Gartner Data & Analytics Summit in 2026 showing that roughly 80% of BI assets across the enterprise environments they manage are unused. The number of reports and dashboards grew 77% year-over-year from 2025 to 2026. Dataset reuse sat at 14%. AI didn't create this problem. It's accelerating it.
It's data FOMO. The fear of not having the information available. So the report stays. It refreshes every day. It consumes server capacity. Someone maintains it when it breaks. Nobody opens it.
The result: you can't build solid foundations when every team maintains their own version of the truth in their own corner. Hundreds of reports, none with the same numbers, no one able to federate people around actions and value generation because there's no single source to point to.
One report, one KPI, one action. If nobody reads it, nobody misses it when it's gone. And automating a report that shouldn't exist is still waste. Faster.
The Eighth: Non-Utilized Talent
Non-utilized talent doesn't fit neatly into either family. It shows up on both sides.
Your Senior Accountant spent years learning cost accounting, becoming a SAP key user, and building financial models from scratch. During the close, they spend two days copy-pasting bank statement lines into a reconciliation template that could be handled by an automated bank feed, a matching rule, or a standard upload.
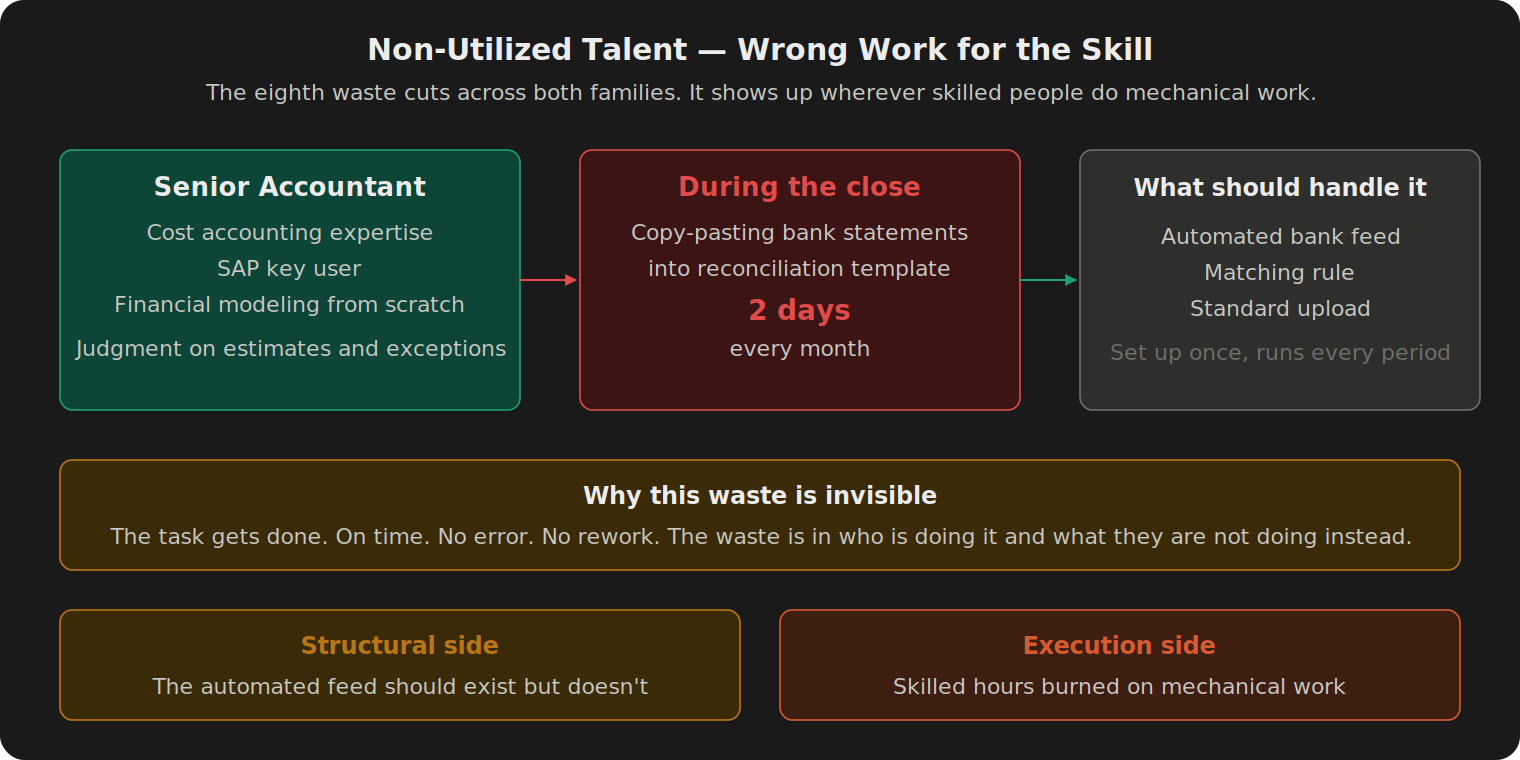
This waste is the hardest to measure because it doesn't show up as idle time or rework. The task gets done. It gets done on time. The waste is in who's doing it and what they're not doing instead. Every hour your best people spend on work that automation, a standard extract, or a system rule could handle is an hour they're not spending on the judgment calls that actually move the close forward.
Where the Hours Actually Sit
In the sample manufacturing close I mapped for this series, the numbers were lopsided.
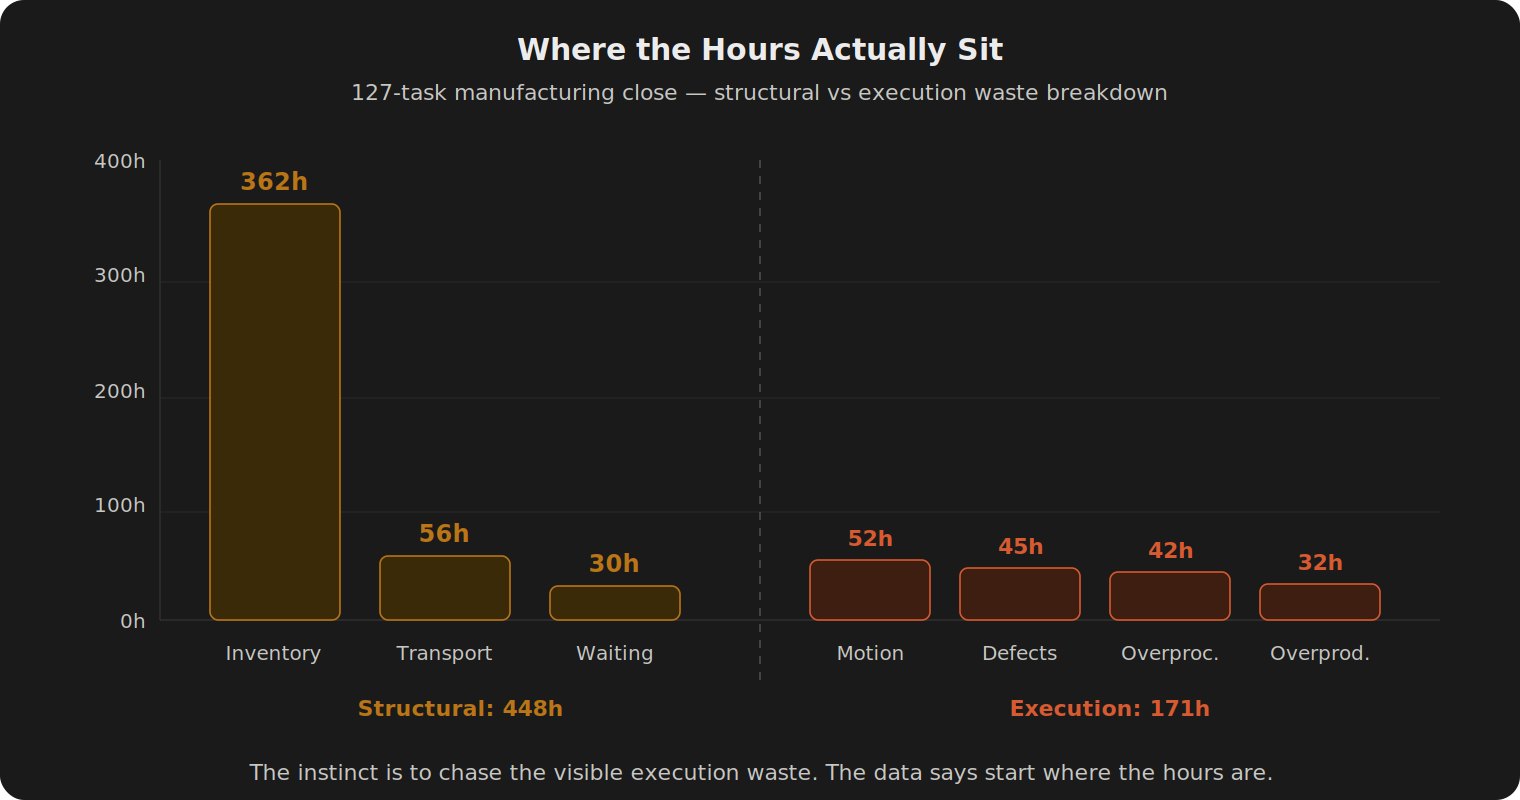
Structural waste totaled 448 hours. Execution waste totaled 171 hours. That doesn't mean active work was only 171 hours. It means 171 hours of active work time was being consumed by motion, rework, overprocessing, and output nobody used. Value-added work sits on top of both. The chart shows only the waste.
Inventory alone was 362 of those 448 structural hours. Most of it was upstream data collection tasks sitting in scheduling windows with large gaps, because ten departments operate on different timelines.
Execution waste was smaller in hours but easier to fix. Motion (52h), defects (45h), overprocessing (42h), and overproduction (32h) together totaled a few thousand dollars per month in direct cost.
Here's the trap. The instinct is to chase execution waste first because it's visible and fixable within your team. At one site I worked with, the controller built an entire improvement project around Defects and Motion because those were problems he could solve without asking anyone's permission. Meanwhile 362 hours of Inventory waste sat untouched because shortening that number means convincing upstream departments to deliver earlier. That conversation is harder than updating a template. So the template gets the project, and the scheduling gap keeps burning time every month.
The data says start where the hours are. Even if the fix is harder to sell.
The Diagnostic
The waste type tells you where the fix lives. That's the whole point of the two-family split.
Back to the opening story. The Staff Accountant's AP accrual was late because Procurement's PO data arrived after the posting window. Structural problem. The Excel training was an execution fix applied to a structural cause. Faster fingers, same bottleneck.
Now flip it. Reclass entries take thirty minutes of rework every month because the journal entry template doesn't match the current account structure. That's Defects. Execution waste. You could formalize an SLA with the upstream team, redesign the handoff, put a project on it. None of that helps. The source data is fine. The template is wrong. Update it. Five minutes. Rework drops to zero.
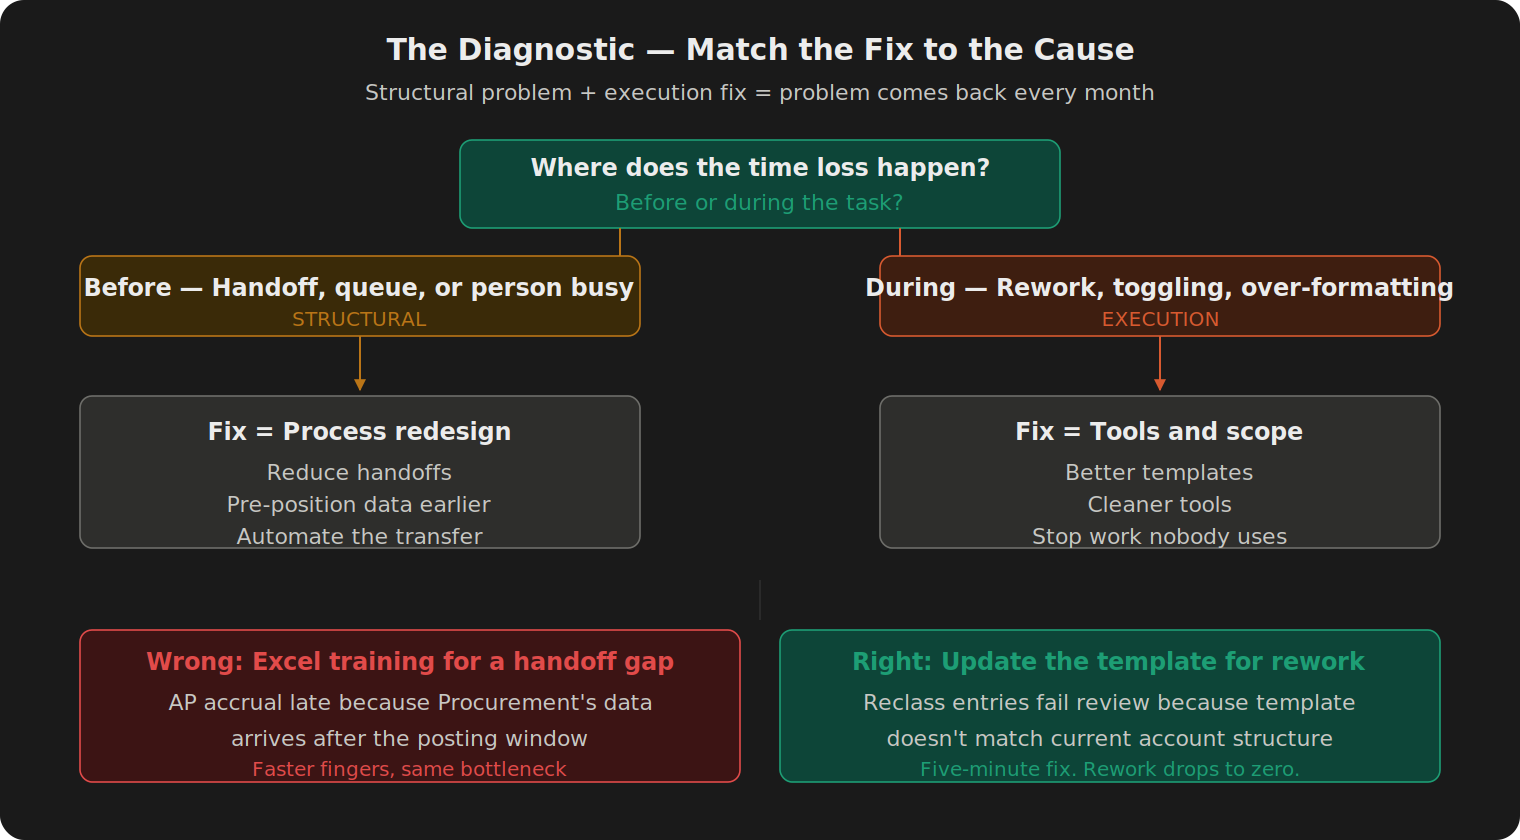
Structural problem, process redesign. Execution problem, tools and templates. If you apply the wrong fix, the task will still break next month no matter how much effort you put in.
Common Pushback
"We don't have time to measure. We're too busy closing." The measurement is the close. You're not adding a separate project. You're timing what you already do. Five tasks per person for one close cycle. Track when it was ready, when it started, and when it finished. The gap between ready and started is structural waste. The time between started and finished is where execution waste lives. One month of data changes the conversation.
"We already know where the waste is. We just can't fix it." You might know intuitively. But can you put a number on it? In classification workshops, the team's estimate of where time goes is consistently off from what the measurement shows. Intuition says "the reclass entries are killing us." The data says reclass entries cost 8 hours a month while the scheduling gap between Procurement and Finance costs 56. Without measurement, the loudest problem gets the project.
"Our leadership won't fund a process redesign for the close." They don't need to. The first pass is free. Eliminate the NVA tasks your team controls: reports nobody reads, duplicate reconciliations, formatting steps where the downstream user doesn't need the formatting. Those don't require a project, a budget, or a steering committee. After confirming there's no real control, compliance, or audit purpose behind them, just stop doing them. The hours you recover fund the harder conversations.
One Gate Before You Eliminate
A task that consumes hours of waiting and queue time looks like waste on the map. And the measurement is correct. But before removing any task, ask whether it exists for a real control, compliance, or audit reason.
If it does, keep it. Simplify it: automate the matching, standardize the exception handling, shift to continuous processing. The goal is less time on the task, not eliminating the task itself.
If no control or compliance reason exists and nobody consumes the output, elimination is appropriate.
Skip this gate and you'll remove a control that an auditor asks about six months later.
Try This Before Next Close
Pick five close tasks that feel slow. For each one, ask a single question: is the time lost because of how the process is designed, or because of how the task is performed?
If the delay is a handoff, a scheduling gap, or a person who's busy with something else, the fix is structural. You'll need someone outside Finance to agree.
If the delay is rework, system toggling, or over-formatting, the fix is execution. You can change it this month.
That question alone changes where you point the improvement effort. And it stops you from sending people to training for problems that live in the process.
What's one close task your team has tried to fix more than once, where the fix never stuck?
FAQ
What's the difference between Overprocessing and Overproduction?
Overprocessing is doing a task to a higher standard than anyone needs. The report exists, but the formatting, detail, or polish exceed what the consumer uses. Overproduction is producing output nobody consumes at all. The report exists, nobody opens it. In practice: if the controller glances at page 1 of your 30-page pack, the other 29 pages are overprocessing. If the controller doesn't open the file at all, that's overproduction.
Can a single task have multiple waste types at once?
Yes, and they usually do. A task might involve a handoff (Transportation), wait in a queue (Inventory), then get done with excessive formatting (Overprocessing). The classification is about which waste type dominates the time loss. Attack the biggest one first.
How do I measure waste if I don't have time tracking in place?
You don't need a formal system. For one close cycle, track three timestamps per task: when it was ready (inputs available), when it started (person began working), when it finished. Ready-to-started is structural waste. Started-to-finished includes both value-add work and execution waste. Five tasks per person for one close gives you enough data to see the pattern.
Does this framework apply outside of month-end close?
Anywhere you have recurring processes with handoffs, yes. Quarterly reporting, annual audit prep, budget cycles, forecast updates. The eight wastes were designed for manufacturing and adapted for office work. The two-family split (structural vs. execution) works for any knowledge process where tasks cross departmental boundaries.
The series so far: SIPOC mapped the close. Value classification sorted what to protect, simplify, and eliminate. Swimlanes made the handoffs visible. Critical path found the tasks with zero margin. Resource leveling showed where people were overloaded. This article showed where time hides and why the wrong fix category guarantees the problem comes back. Next: when the same task breaks every month, how do you find the actual cause instead of patching the symptom?
If you want to measure all eight waste types across 127 tasks with auto-calculated structural waste and a tracked improvement plan, that's part of Month-End Close Optimization: Run Your Close Like a System, Not a Fire Drill on GoFast.Finance.
This article originally appeared in the Practical Lean Finance newsletter on LinkedIn.
Sources
Ohno, T. (1988). Toyota Production System: Beyond Large-Scale Production. Productivity Press. Original identification of seven manufacturing waste categories.
Lean Enterprise Institute. The eight wastes of lean. lean.org. DOWNTIME mnemonic and the addition of non-utilized talent as the eighth waste.
Liker, J. K. (2004). The Toyota Way: 14 Management Principles from the World's Greatest Manufacturer. McGraw-Hill.
Tapping, D., & Shuker, T. (2003). Value Stream Management for the Lean Office. CRC Press. Application of Lean waste concepts to administrative and information-flow processes.
Datalogz. (2026). Theater session at the Gartner Data & Analytics Summit 2026 with Matt Robuck (VP of Data and Analytics, Georgia-Pacific) and Richard Martin (Senior Director, PepsiCo). Roughly 80% of BI assets unused across managed environments. 77% year-over-year increase in reports and dashboards. Dataset reuse at 14%. Source: resources.datalogz.io.