- Apr 11
Your Close Has a Critical Path. You've Just Never Seen It.
- Arnaud Lemaire
- Accounting & Auditing
- 0 comments
Part four of the Practical Lean Finance series. Previous articles covered SIPOC mapping, value classification, and swimlane handoff analysis. This one puts a number on every task: how much buffer it has, whether it's on the critical path, and where your close is structurally likely to break.
Think about the last time your management reporting package was late.
Not late because someone was slow. Late because a subledger wasn't closed yet. Because an accrual came in after you'd already started the analysis. Because the trial balance you pulled at 2 PM was different from the one you pulled at 9 AM, and now half your variance commentary is wrong.
You've re-run that analysis before. Maybe twice in the same close. You knew something upstream was still moving. You just couldn't see exactly what depended on what, or which delay actually mattered.
Now a question. Have you ever seen the full dependency network for your month-end close? The actual map of which task feeds which, which chains run in parallel, and which single task sits at the end of every chain with zero room for delay?
If you have, raise your hand. You're in a very small minority. The rest of us have been running what is arguably the most repeated, most stressful project in accounting without the one tool that tells you where to focus.
That tool has existed since 1957. It's called the Critical Path Method.
Your checklist is hiding a network
Most finance teams track the close as a list. A spreadsheet with task names, owners, due dates, and a status column. Maybe color-coded. Maybe in a close management tool that's really the same spreadsheet with a login screen.
The problem with a list is that it treats every task as independent. Task 14 is red? Chase task 14. But task 14 might be waiting on task 7, which is waiting on task 3, which is waiting on data from Operations that won't arrive until tomorrow. Chasing task 14 accomplishes nothing. The constraint is three steps upstream.
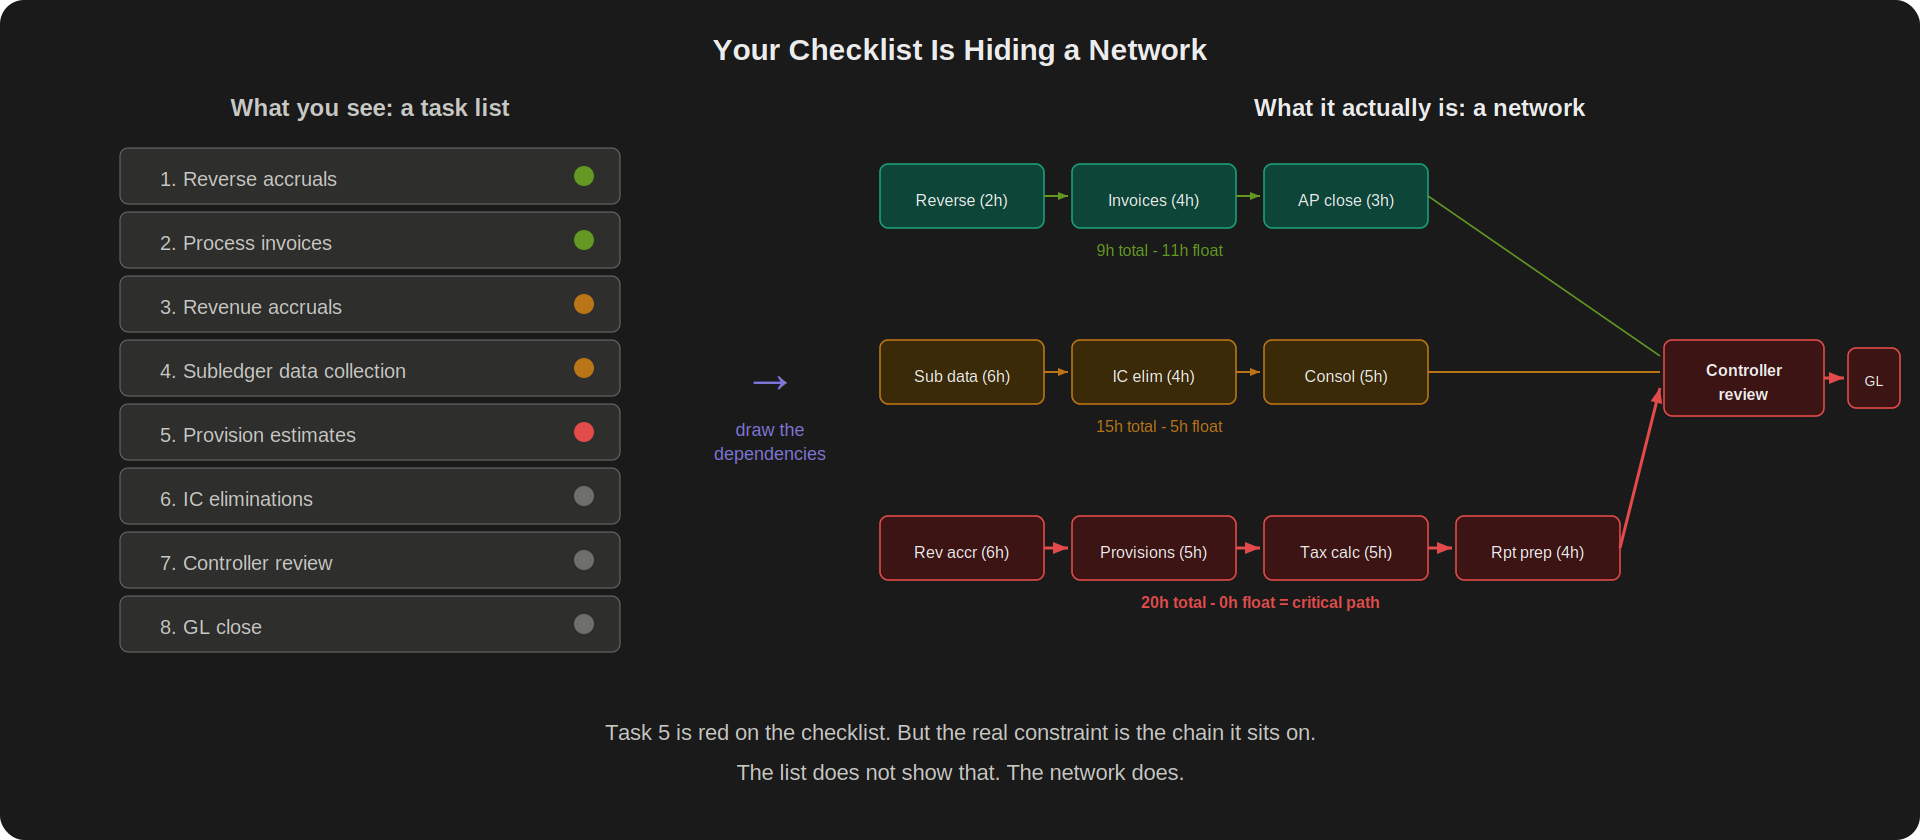
When you draw the predecessor links between tasks, the list becomes a network. Parallel chains become visible. Bottlenecks become obvious. And the longest chain through the entire network, the one that determines the minimum time your close can take, becomes measurable.
That longest chain is the critical path.
What the close looks like as a network
CPM was developed by Morgan Walker at DuPont and James Kelley at Remington Rand for scheduling plant maintenance shutdowns (Kelley & Walker, 1959). Construction, defense, and manufacturing have used it for decades. Finance mostly hasn't. Which is strange, because a month-end close is a textbook CPM problem: dozens of tasks, hard dependencies, parallel chains, a fixed deadline, and a team that can't do everything at once.
Here's the logic in plain language.
Every task in your close has predecessors: things that must finish before it can start. String those predecessor links together and you get chains. Multiple chains run in parallel. The longest chain through the entire network determines the minimum time your close can take. That's the critical path.
Some tasks can't start based on dependencies alone. They're pinned to external dates. Bank statements aren't available until the period ends. The ERP period doesn't open until the system administrator says so. Regulatory filing deadlines are fixed. CPM handles these as date constraints, which is why a close schedule needs both: the dependency chain and the calendar.
Take a real example from a 127-task manufacturing close. The AP subledger chain runs five tasks deep: reverse prior-period accruals, process final invoices, post new accruals, run the aging review, close the subledger. Each task feeds the next. The whole chain has 11 hours of float. More than a full business day of buffer.
Now look at the tail end of the same close. Controller review of the full financial package: zero float. Management reporting submission: zero float. GL period close: zero float. Eight tasks total, all zero-float, all clustered at the end. Every upstream delay in the entire network accumulates here.
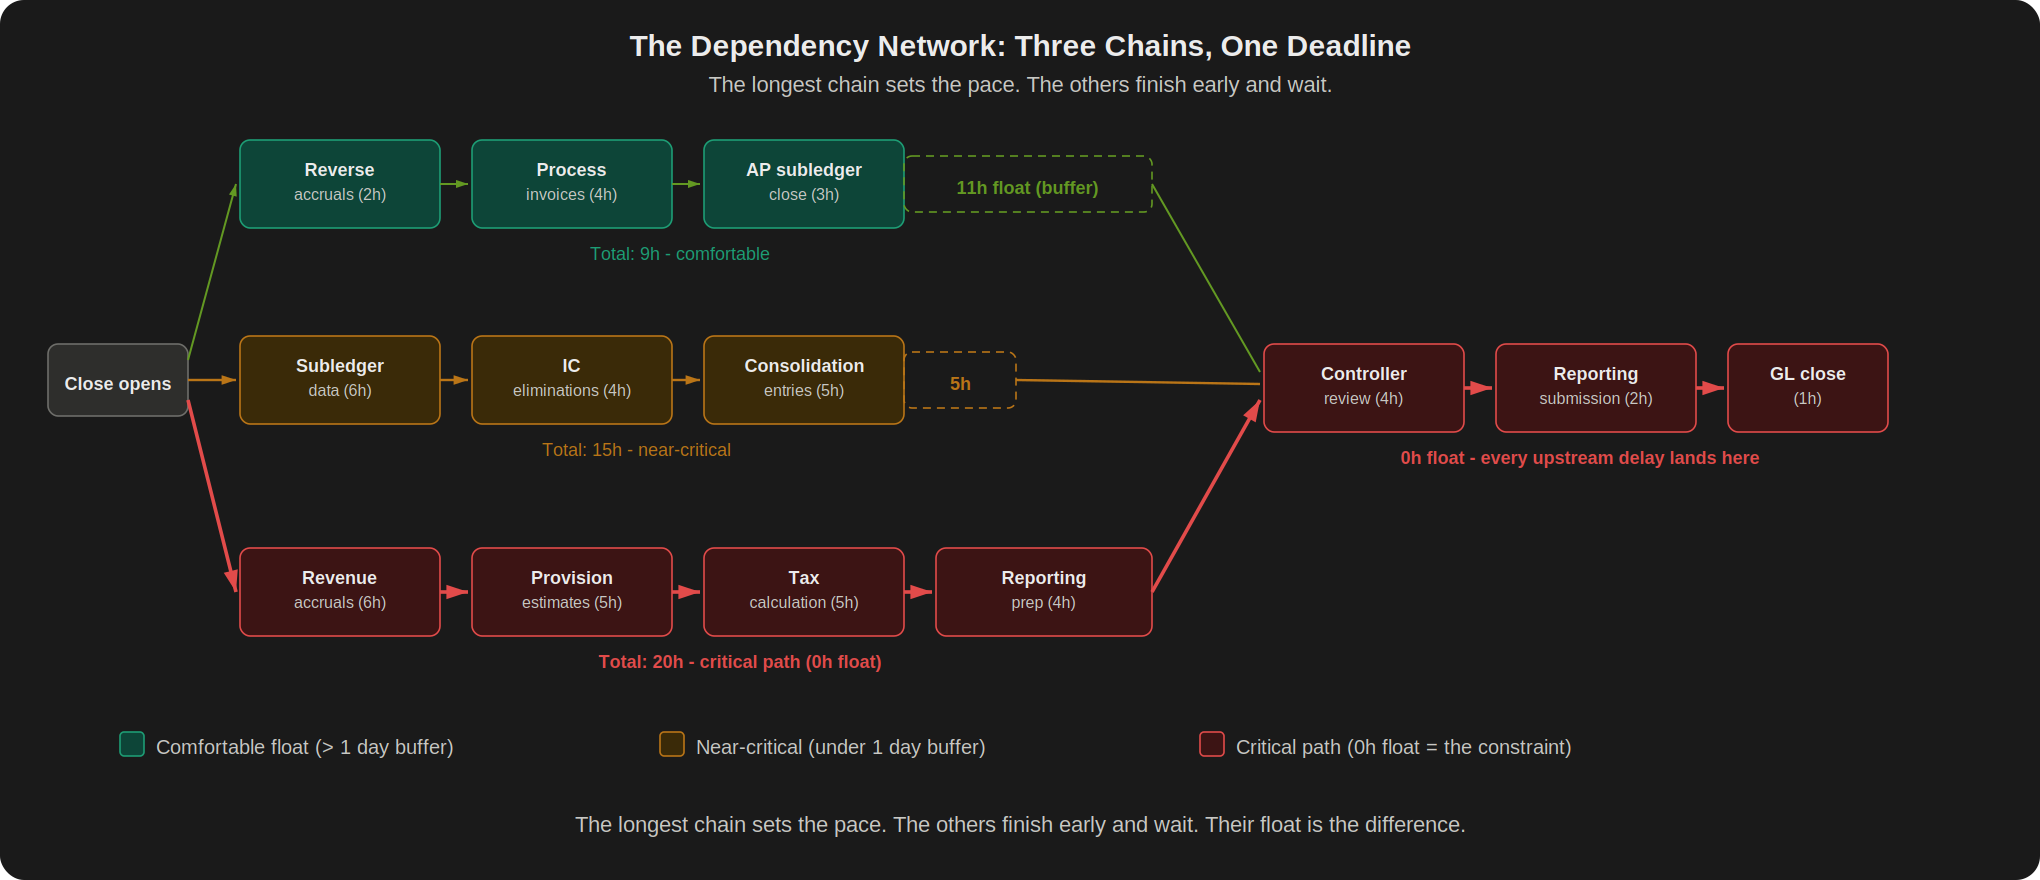
Three parallel chains, one deadline. Only the zero-float path controls when the close finishes.
What float actually means
Your AP subledger chain has 11 hours of room to slip before anything downstream moves. Your controller review has none. Zero. One hour late there, one hour added to the entire close. That gap has a name: float.
CPM calculates two values for every task. The earliest it can start (based on when its predecessors finish) and the latest it can start without pushing the deadline. Float is the gap between those two.
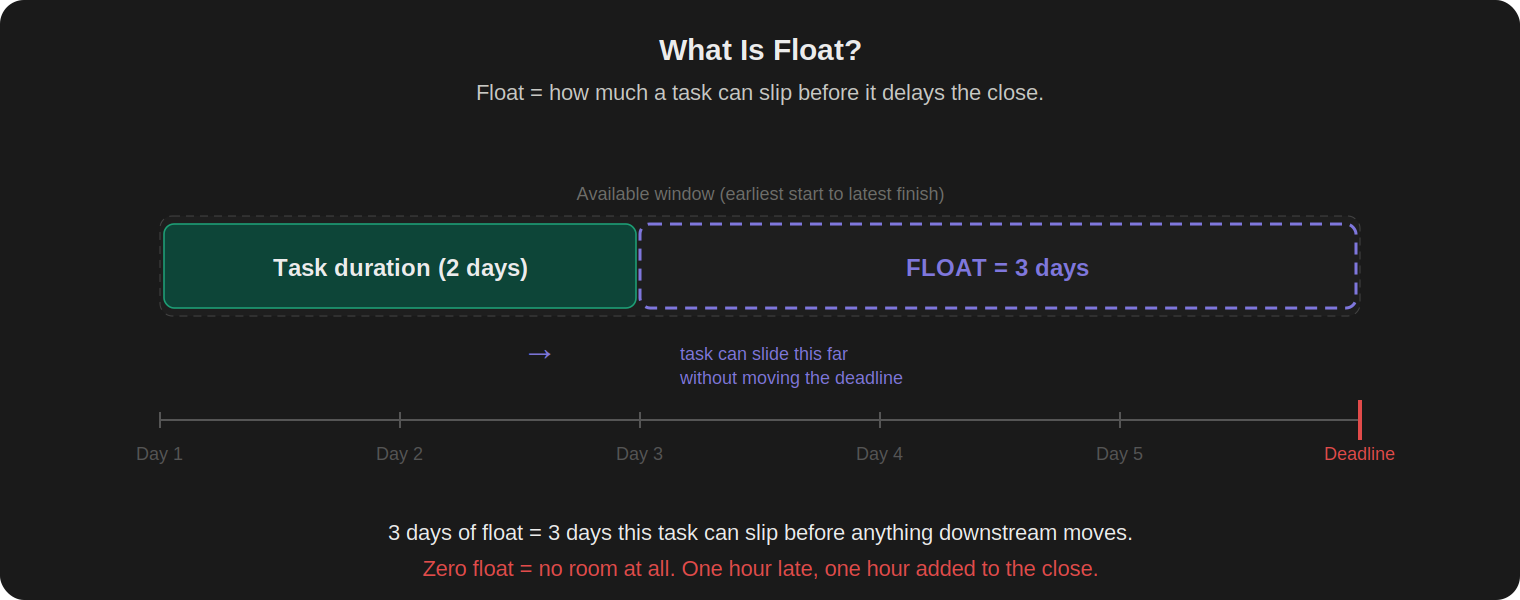
A task with 10 hours of float can slip 10 hours and the close still finishes on time. A task with zero float has no margin at all. One hour late, one hour added to the close.
You've been doing a version of this in your head every close. You know the consolidation can't start until the subledgers are done. You know the controller review comes last. CPM just makes the entire network visible at once and puts a number on each task's buffer.
In the sample workbook, 8 tasks out of 127 have zero float. But 31 tasks, about a quarter, have less than 8 hours: less than one business day of buffer. Those are your near-critical tasks. They're not on the critical path today, but one small slip puts them there.
Float tells you where to spend your adrenaline
It's Day 3 of the close. Two problems land on your desk at the same time.
The fixed asset depreciation run is going to be four hours late. The asset register update from facilities took longer than expected. And the intercompany elimination entries are also four hours behind because one subsidiary's subledger close slipped.
Your instinct says chase the depreciation. It's visible. Auditors ask about it. The controller will notice if it's missing from the package. The intercompany eliminations feel more routine.
But the fixed asset chain has 14 hours of buffer. A 4-hour delay consumes some of it, but nothing downstream moves. The intercompany chain has 6 hours. A 4-hour delay leaves 2 hours of margin for every remaining task on that chain. One more small slip anywhere and it becomes critical. The task you should be chasing is the one that feels more routine.
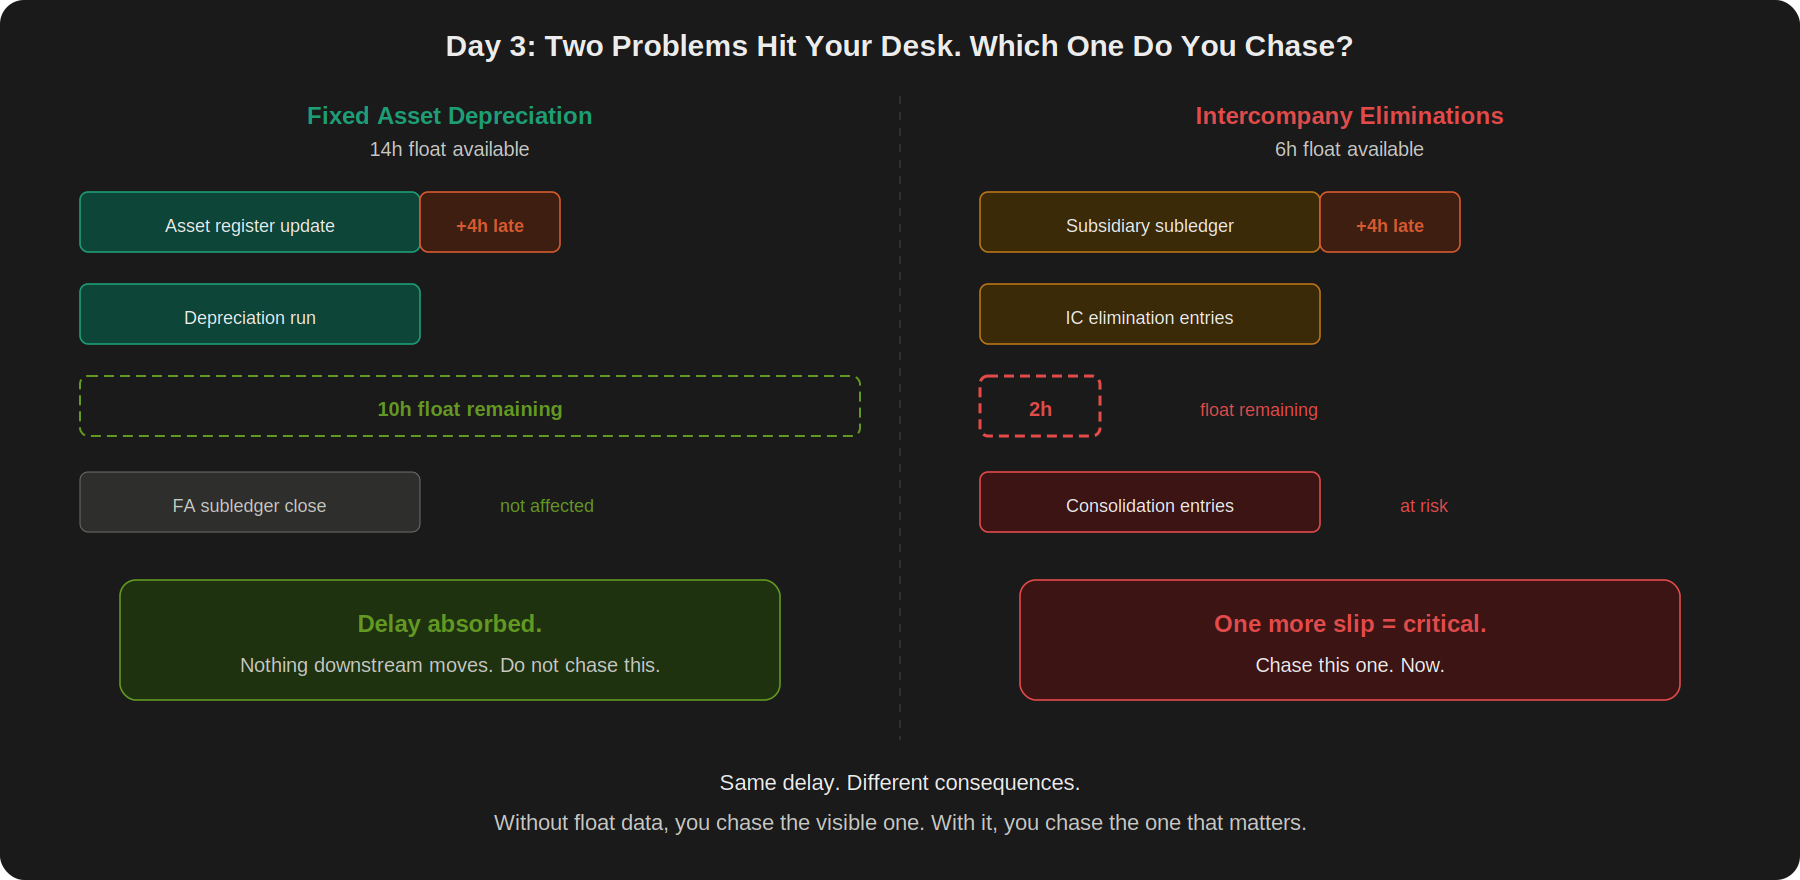
Same delay. Different consequences. Float tells you which one to chase.
That's what float does. Without float data, you prioritize by visibility, by audit sensitivity, by whoever escalates loudest. With it, you prioritize by what actually moves the deadline.
Where your close actually breaks: convergence points
Some tasks have one predecessor. If it's late, the downstream task is late. Simple chain, simple risk.
But some tasks have five. In the manufacturing close, posting AP accruals depends on five separate inputs from different teams: late invoice estimates from Procurement, vendor rebate data from Commercial, the open PO review from Purchasing, budget owner accrual requests from Operations, and final AP invoice processing. All five must be done before the posting can start. One late input and it waits.
In scheduling, this is called a convergence point. It carries a risk that CPM doesn't show you in the float numbers.
If each predecessor has a 90% probability of finishing on time, the probability that all five finish on time is 0.9^5 = 59%. The task is more likely to be delayed than not, even when every single input is individually reliable.
In scheduling, this is called merge bias. Three predecessors at 90% each: 73%. Five: 59%. Seven: 48%. The more inputs a task waits for, the faster the math works against you.
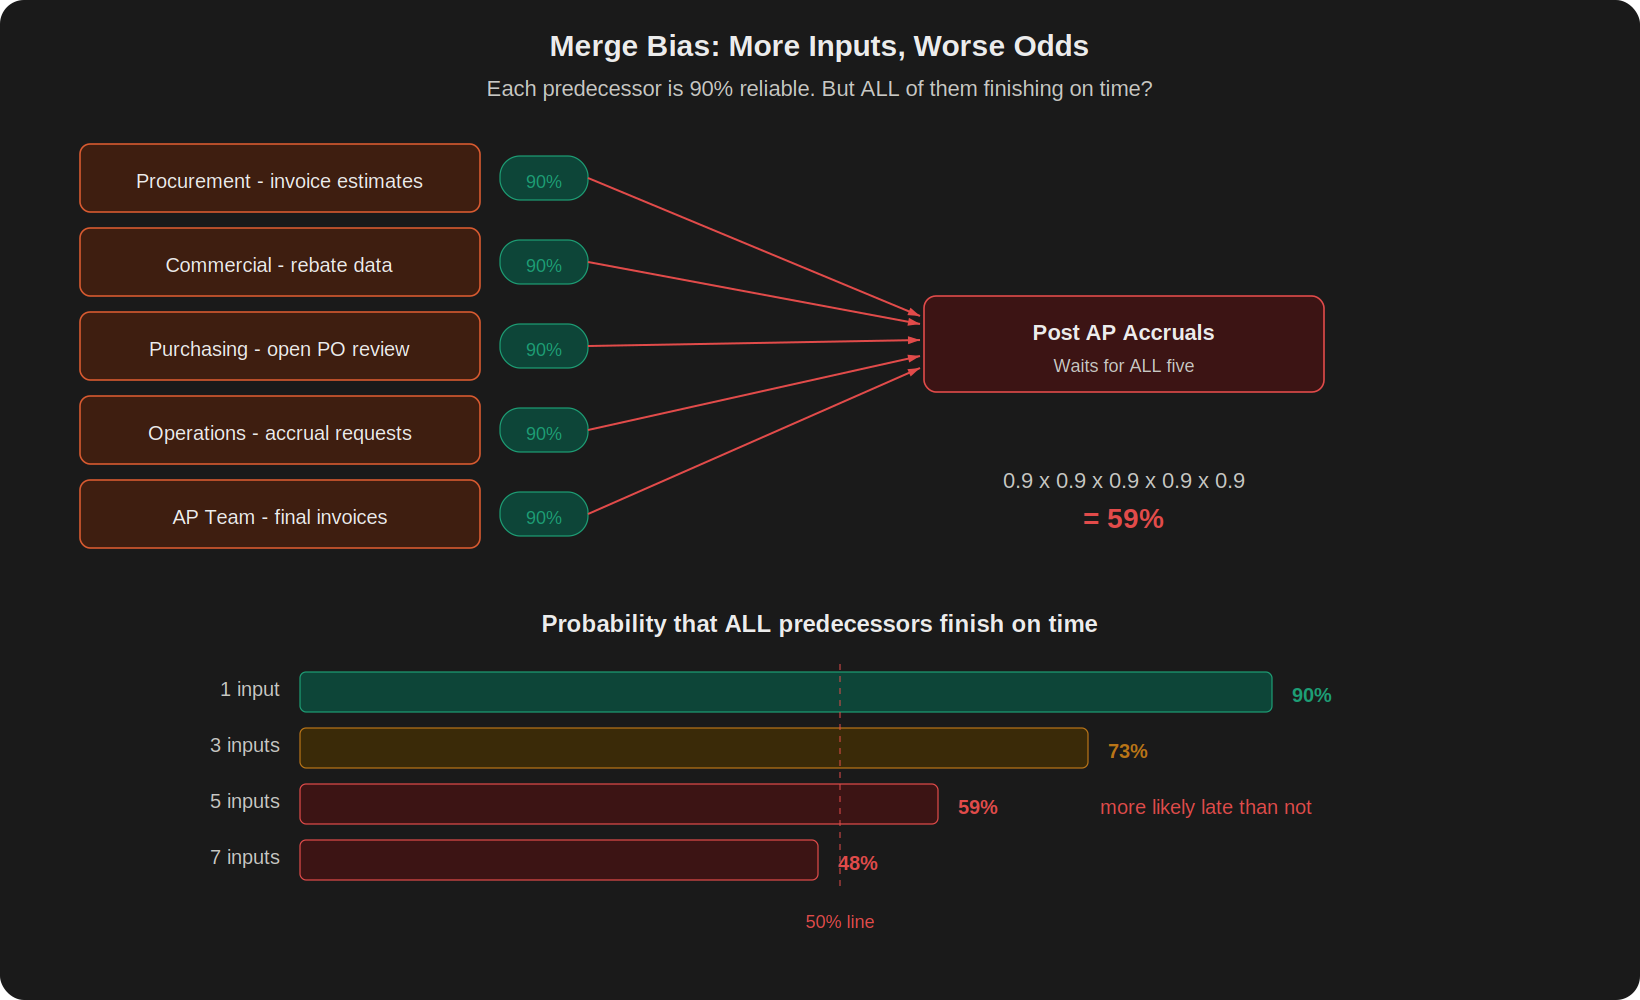
Five predecessors, each 90% reliable. The task they feed is more likely late than on time.
In your close, convergence points sit where subledger data flows into consolidation or reporting. The close doesn't break at the zero-float tasks at the end. Those are the symptom. It breaks at the merge points upstream that feed them. When you review your dependency network, convergence points deserve scrutiny even when their float looks comfortable. The float assumes every predecessor finishes on time. The probability math says otherwise.
Common mistakes when applying CPM to the close
After running this exercise across multiple sites, the same mistakes show up.
1. Treating the close as one chain instead of a network. Teams list tasks in the order they think about them and draw a single sequence. But the close isn't one chain. It's multiple parallel chains that converge. If you flatten it into a sequence, every task looks critical and the real bottleneck is invisible.
2. Confusing calendar order with dependency. "We do the bank recon on Day 2" is a scheduling habit, not a dependency. The question is: what must actually finish before the bank recon can start? If the answer is "the bank statement needs to be available," that's the real predecessor. If nothing else blocks it, it could start on Day 1. Teams inherit calendars from predecessors and never question whether the sequence reflects real dependencies or just tradition.
3. Thinking float protects convergence points. You read the float number on a task with five predecessors and it says 8 hours. Comfortable. But that 8 hours assumes all five predecessors finish on time. The merge bias math from the section above says they probably won't. Float measures buffer in the best case. Convergence points need scrutiny regardless of what the float says.
4. Using float as permission to relax. A task with 14 hours of float isn't safe. It's 14 hours away from becoming critical. If the team treats float as slack time and lets tasks drift to their latest start, every chain runs at zero margin. Float is a buffer, not an invitation to start late.
5. Building the CPM once and filing it. After each close, compare actual durations to estimates. Update the network. One close gives you a model. Twelve closes give you a diagnostic.
From one-time tool to monthly diagnostic
CPM was built for one-time projects: build a bridge, launch a satellite, shut down a plant. A month-end close is none of those things. It runs every month with the same tasks, the same team, the same general sequence. That repetition changes everything.
Your duration estimates aren't guesses. They're calibrated against last month's actuals. And the month before that. Over time, the model gets accurate because it's trained on real performance, not a planning workshop.
The critical path becomes a diagnostic. Same 8 tasks on the critical path every month? That's a structural constraint. Fix those tasks and the entire close gets shorter. Different tasks each month? Upstream delivery is unreliable and variation is propagating through the network. Both patterns are actionable. Without the data, you're guessing which one you have.
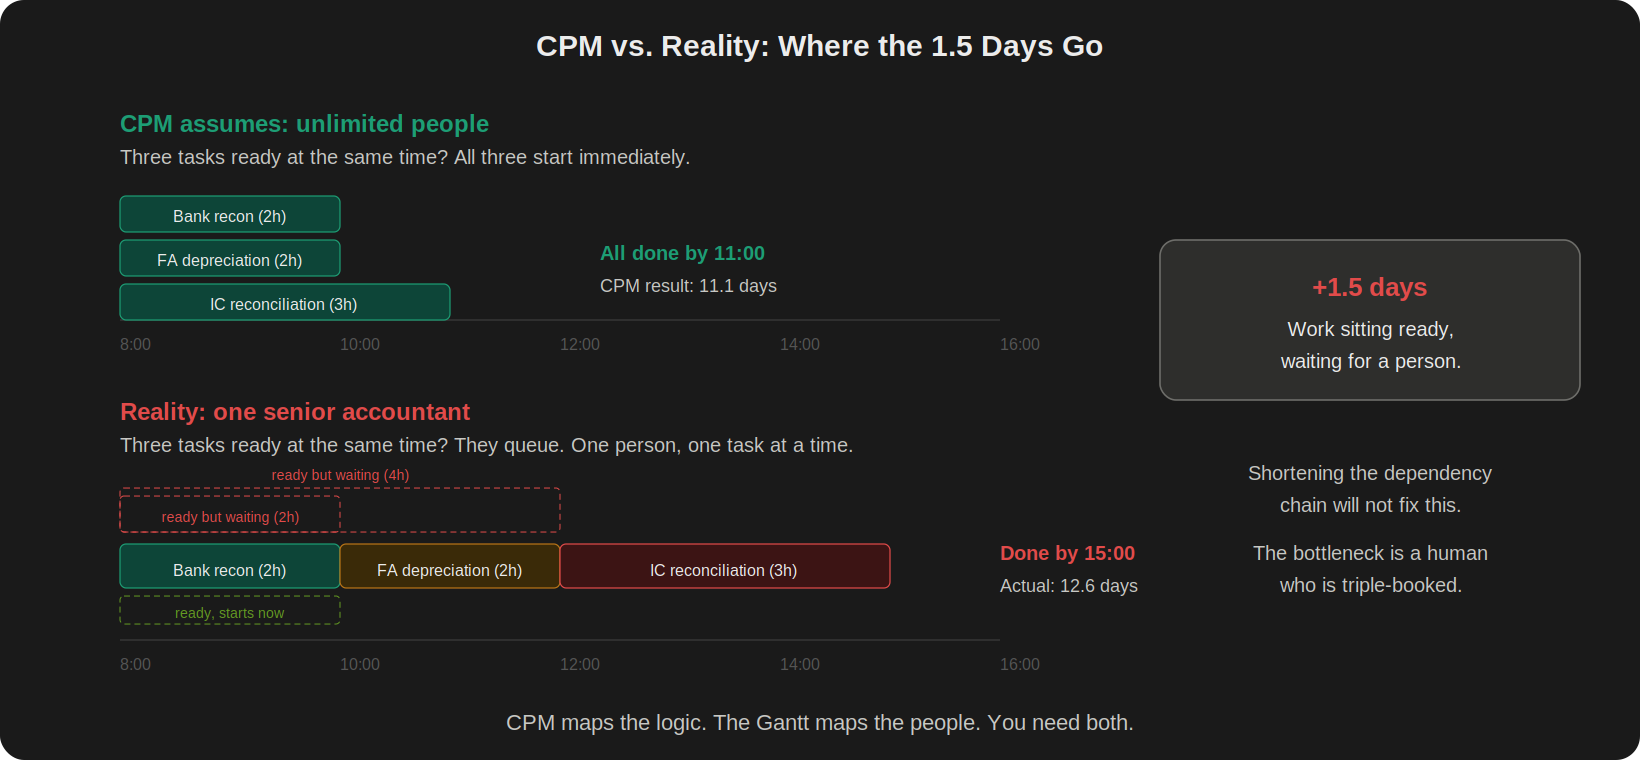
One caveat. CPM assumes every task starts the moment its predecessors finish. That implies unlimited people: if three tasks become ready simultaneously, all three get worked at once. Your team can't do that. In the sample workbook, CPM calculates 11.1 business days. The actual resource-constrained schedule: 12.6 days. That 1.5-day gap is resource contention. Work sitting ready, waiting for a person who is busy with something else. Shortening the dependency chain won't fix it if the bottleneck is a human who's triple-booked on Day 2. The next article introduces resource-constrained scheduling and the Gantt chart to address that gap directly.
Try this before next close
Pick one chain from your close. Start at the final deliverable (the reporting package, the GL close, whatever lands last) and trace backward. For each task, write down what must finish before it can start. Keep going until you hit a task with no predecessor or an external date constraint.
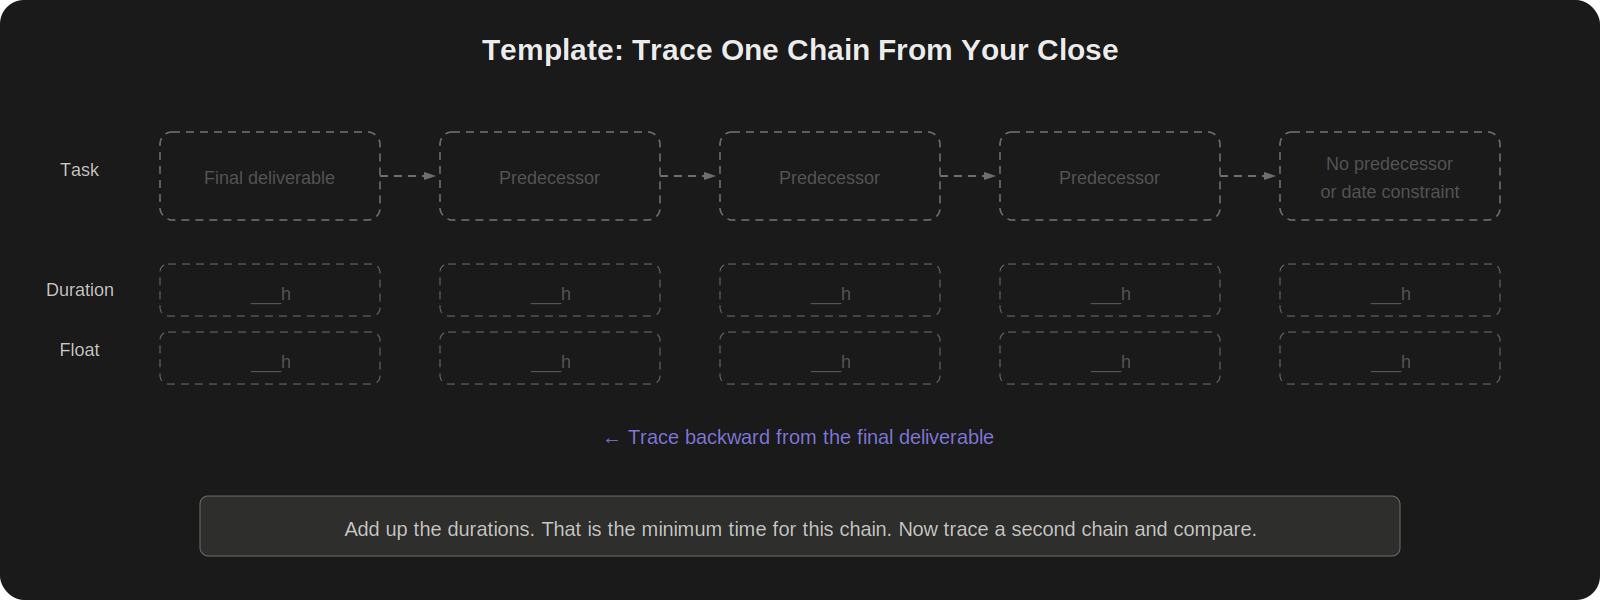
Estimate the duration of each task you found. Add them up. That's the minimum time for that chain. Now do a second chain. Compare. The longer one controls your deadline. You've just found a piece of your critical path.
One chain won't map your whole close. But it will change what you think is slowing it down.
What comes next
The SIPOC article mapped the close. The classification article told you what to protect, simplify, and eliminate. The swimlane article showed where the invisible time hides in handoffs. This one put a number on every task's buffer and showed where the network is structurally likely to break.
Next: your critical path says the close should take 11 days. It actually takes 13. The gap isn't in the dependencies. It's in the people. Resource-constrained scheduling and the Gantt chart.
If you want to build the full dependency network for your own close with auto-calculated float, critical path identification, and convergence risk flags in a working Excel model, that's Lesson 5 of the Month-End Close Optimization course on GoFast.Finance.
→ Month-End Close Optimization: 10 lessons, one working system
Frequently asked questions
Can the critical path change between closes?
Yes, and tracking whether it does is the whole point. If the same 8 tasks sit on the critical path every month, you have a structural constraint. Shorten those tasks and the entire close gets shorter. If different tasks appear each month, upstream delivery is unreliable and variation is propagating through the network. The first pattern needs process redesign. The second needs upstream discipline. Without tracking it month over month, you're guessing which problem you have.
Why is my close always late even when individual tasks finish on time?
Probably merge bias. When a task depends on five inputs from five different teams, each input might be 90% reliable on its own. But the probability that all five arrive on time is only 59%. The more predecessors a task has, the worse the odds get. Your close breaks at the convergence points where multiple chains merge, not at the individual tasks. Drawing the dependency network makes those merge points visible.
How is CPM different from a Gantt chart?
CPM maps the logic: which tasks depend on which, and what the minimum duration is assuming unlimited resources. A Gantt chart maps the schedule: who does what, when, and in what order given the actual team you have. CPM might say 11 days is the minimum. The Gantt shows it takes 13 because the same person is assigned to three tasks that are ready simultaneously. You need both. CPM first, Gantt second.
How long does it take to build a CPM model for the close?
For a 100+ task close, expect two to three days of focused work the first time: listing tasks, identifying predecessors, estimating durations, and drawing the network. After the first close, updates take a few hours because the structure doesn't change much. The payoff is immediate: you know on Day 1 which tasks have zero margin and where the convergence risks are hiding.
Sources
Kelley, J. E. & Walker, M. R. (1959). "Critical-path planning and scheduling." Proceedings of the Eastern Joint Computer Conference, 160-173. Origin of CPM at DuPont for plant maintenance shutdowns.
Schuyler, J. R. (2001). Risk and Decision Analysis in Projects (2nd ed.). Project Management Institute. Merge bias and convergence risk in schedule networks.
PMI (2004). "Schedule risk analysis simplified." PMI Global Congress Proceedings. Parallel converging paths and overrun probability.
Ledge, "The State of Month-End Close in 2025." 50% of finance teams take 6+ business days to close. 94% still rely on Excel.
APQC Open Standards Benchmarking. Median close cycle: 6.4 business days (n=2,300+ organizations).
FloQast & University of Georgia, "2022 Controller's Guidebook." 81% say month-end close disrupts personal lives.
This article originally appeared in the Practical Lean Finance newsletter on LinkedIn.