- Apr 19
Your Senior Accountant Has 10 Hours on Day 3. Your FP&A Analyst Has Nothing Until Day 5.
- Arnaud Lemaire
- Accounting & Auditing
- 0 comments
Resource-constrained scheduling applied to the month-end close: why the theoretical minimum doesn't match reality, and how to tell whether your bottleneck is a task problem or a people problem. This is Part 5 of the Practical Lean Finance series. If you're joining here, start with Article 1: SIPOC to see how the 127-task manufacturing close was mapped.
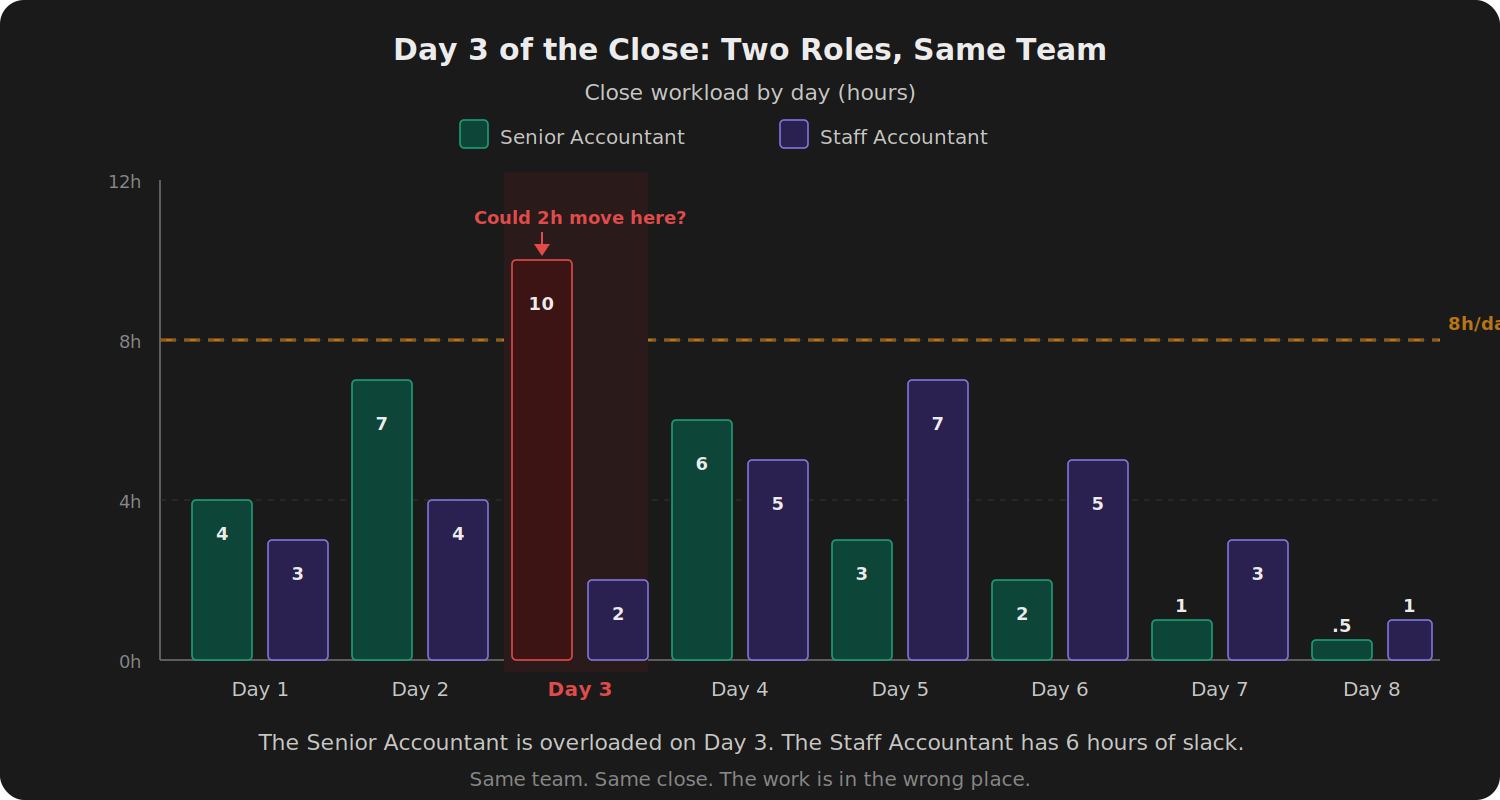
It's Day 3 of the close. Your Senior Accountant has 10 hours of close work stacked in front of her. The balance sheet reconciliation is ready. The bank rec is ready. Three other tasks are ready. She has an 8-hour day, and between non-close responsibilities, maybe 5 of those hours are actually available. Half the work waits until tomorrow.
Down the hall, the FP&A Analyst has nothing to do until Day 5.
You've been in this room before. Staring at a checklist where half the items are "waiting on Sarah" and the other half are "not yet relevant for Tom." The tasks are sequenced correctly. The team isn't.
In the last article, we found the critical path through the 127-task manufacturing close: 8 tasks with zero margin, adding up to a theoretical minimum of 11.1 business days. But the actual close takes 12.6. Same tasks. Same dependencies. Same network. A day and a half more than the math says it should.
That gap isn't task complexity. It's people. Work sitting ready while the person assigned to it is somewhere else.
The critical path tells you which tasks matter. It doesn't tell you whether anyone is available to do them. For that, you need a different layer on the schedule.
Adding People to the Theory
The idea is simple. Take the CPM network and add one constraint: each role has a limited number of hours per day dedicated to the close. When two tasks need the same person in the same slot, one waits.
In project management, this is called resource-constrained scheduling. The CPM schedule is the theory. The resource-constrained schedule is the reality. The gap between them is time spent waiting for people, not for data.
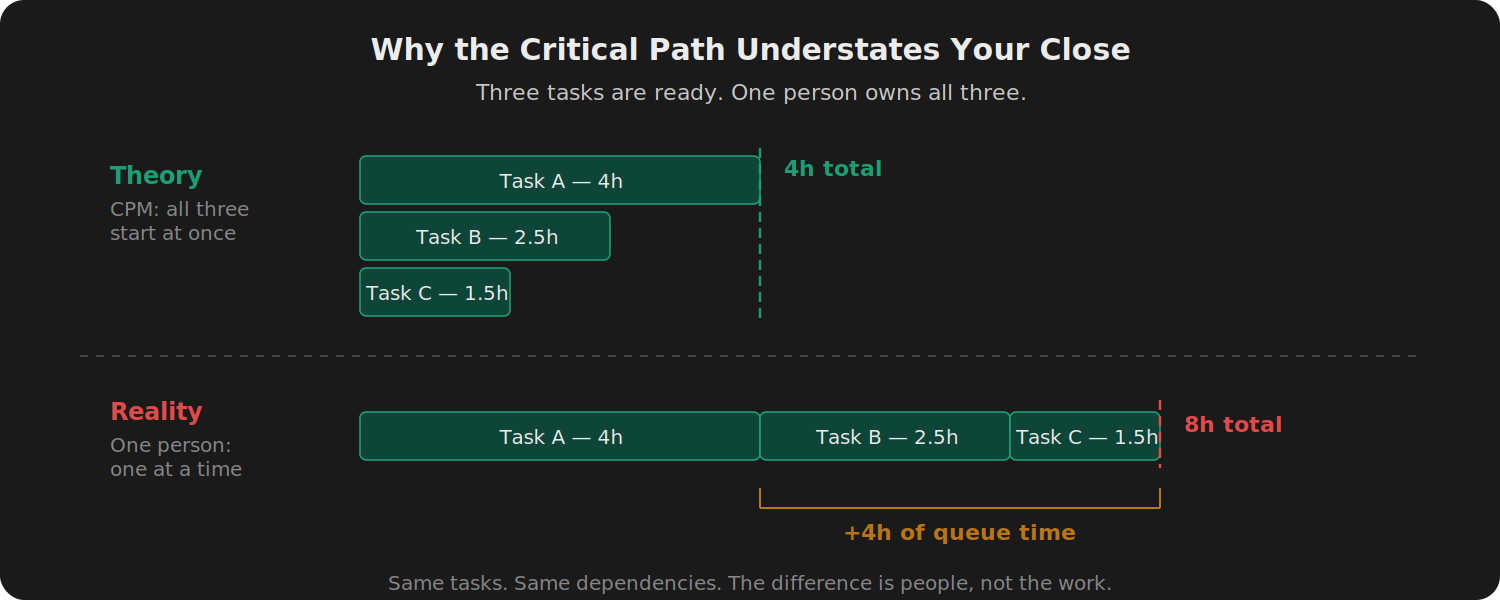
In the sample close: CPM finishes at hour 89, about 11.1 business days. The resource-constrained schedule finishes at hour 101, about 12.6 days. Twelve hours of scheduling friction. The ratio of CPM duration to resource-constrained duration is 88%. Twelve percent of the timeline is pure queue time.
Article 3 showed you the cost of crossing buildings. Different functions, different time zones, different languages. This one shows you the cost of a traffic jam inside your own building. Same function, same team, not enough people at the same time.
19.5 Hours of Waiting on a 4-Hour Task
The close-level number is useful. The task-level number is where you actually make decisions.
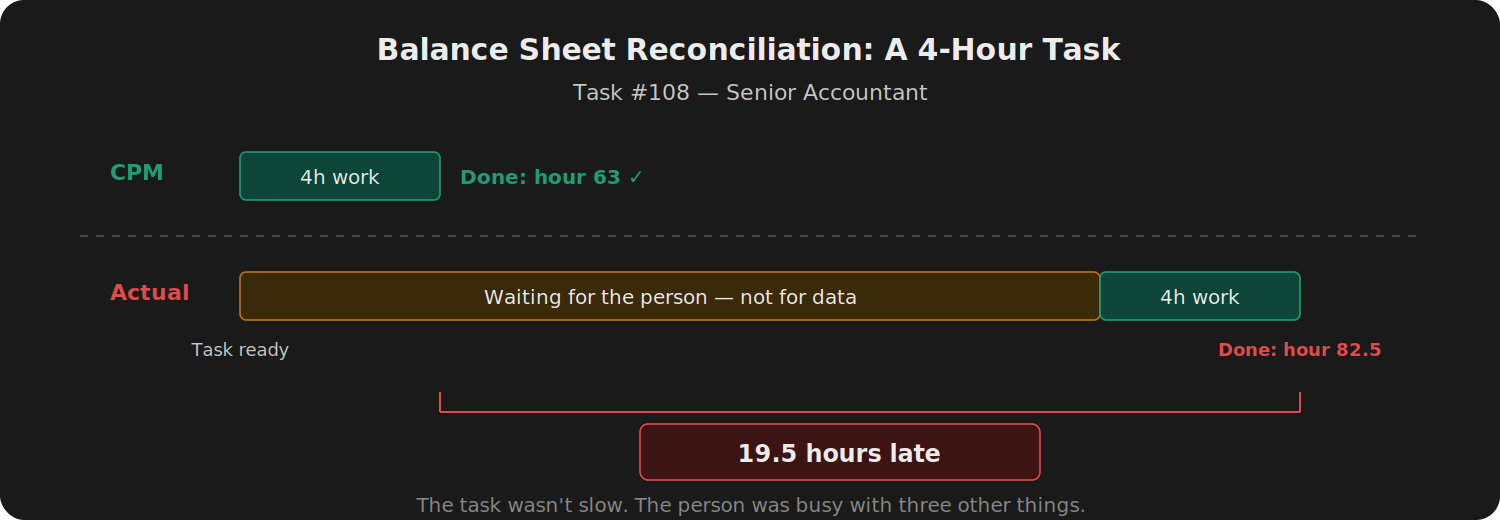
Task #108: balance sheet reconciliation, all material accounts. A 4-hour task. Senior Accountant owns it. The critical path says it should finish by hour 63. The resource-constrained schedule says it finishes at hour 82.5.
19.5 hours of delay on a task that takes 4 hours.
The task is ready long before the Senior Accountant can get to it. She doesn't start until hour 72. Not waiting for data from Procurement. Waiting to finish the three other things on her desk.
Same pattern on the bank reconciliation: 16.5-hour gap, Staff Accountant. The work is ready. The person is somewhere else.
Two tasks, two different roles. That's not one person's bad time management. That's a design flaw.
These numbers come from a full manufacturing close I mapped and built into a working model on GoFast.Finance. The tasks, roles, and delays are from a real close.
Fix the Right Thing
Here's the mistake I've watched teams make more than once.
You look at the balance sheet reconciliation and think: that task is always late, let's make it faster. You spend two weeks redesigning the template. Automate the data pull. Streamline the review. You save 30 minutes.
The close doesn't get faster. The Senior Accountant is still stacked 10 hours on Day 3. The 19 hours of scheduling delay? Untouched.
You fixed a 4-hour task when the problem was a 19-hour queue.
Every task in your close has two finish times: the CPM finish and the resource-constrained finish. The gap between them is your diagnostic.
Large gap: the task was ready but the person wasn't free. That's a staffing problem. Could you move one of the Senior Accountant's Day 3 tasks to the Staff Accountant? Could you shift the reconciliation a half-day earlier by resequencing a predecessor? Those are scheduling fixes.
Small gap: the person was mostly available. The task duration is the constraint. That's a process problem. Automate a step, simplify the template. The fix lives inside the task, not around it.
Take an intercompany reconciliation later in the close. The CPM-to-RCS gap is small: maybe 2 hours. The FP&A Analyst who owns it had capacity when the task landed. The task itself takes 6 hours because every month she rebuilds the reconciliation from scratch: re-pulling the data, reformatting three subsidiary exports into a common layout, manually matching by entity and currency. Someone suggests redistributing the team to help. But the person was already free. The 6 hours is the bottleneck, not the staffing. You'd be reshuffling people around a task that needs a better template, or an automated data pull, or a standing report that doesn't require a rebuild every month.
The diagnostic is binary: large gap, fix the schedule; small gap, fix the task. Apply the wrong lever and you burn effort on something that was never the constraint.
I've seen the wrong-fix problem play out at scale with Shared Services Centers. The logic sounds like a resource fix: move tasks to a central team, free up site controllers' capacity. More people available means shorter queues.
But in practice, when the task split between sites and central is badly designed, you haven't moved the constraint at all. The site controller still has to provide the input. The SSC can't start without it. Then the SSC completes the task, and the site controller has to review the output and correct what the SSC got wrong because they don't know the plant. Two people are now involved in a task that one person used to own. The Gantt doesn't show a shorter bar. It shows the same bar with a handoff in the middle and two queues instead of one. (Article 3 traces this pattern through a full AP accrual swimlane.)
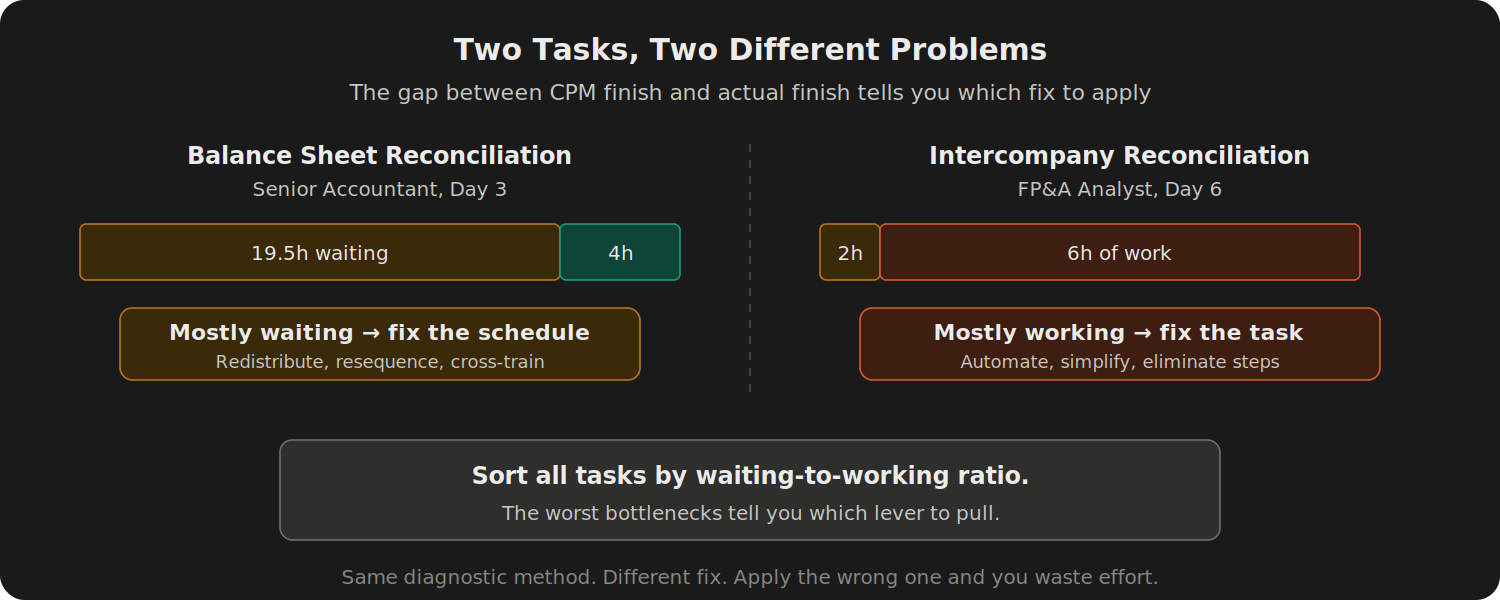
Sort your task list by the CPM-to-RCS gap. The worst bottlenecks surface immediately.
Where the Work Piles Up
Once you know the diagnostic, the next question is where. Plot every task on a Gantt chart with half-day slots and the picture becomes physical. Dense cluster of bars from Day 1 through Day 3. Almost empty from Day 7 onward. Front-loaded close. That's where overruns start.
But the Gantt by itself just shows when things happen. What you need is the load underneath: how many hours each role is carrying in each slot.
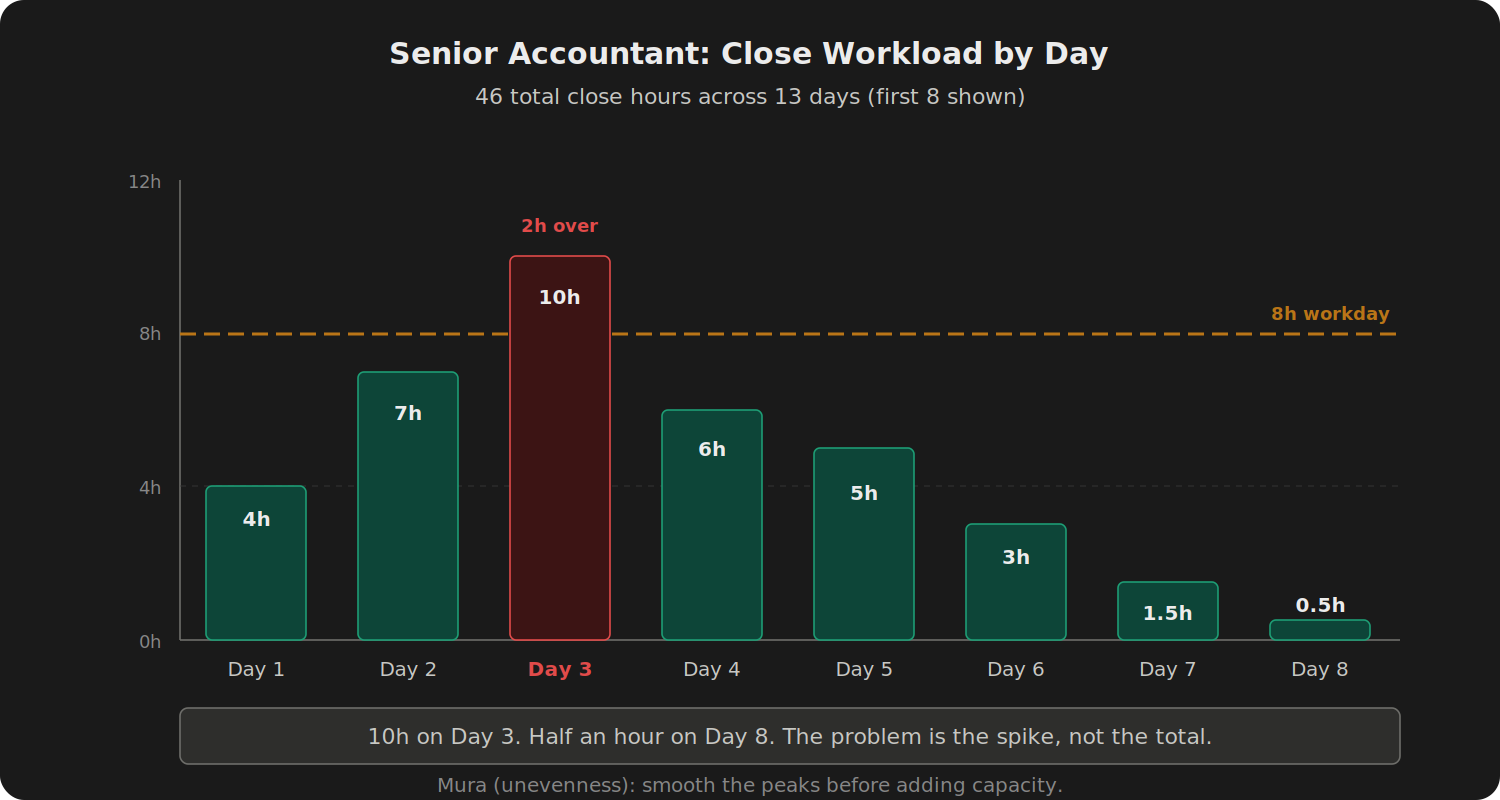
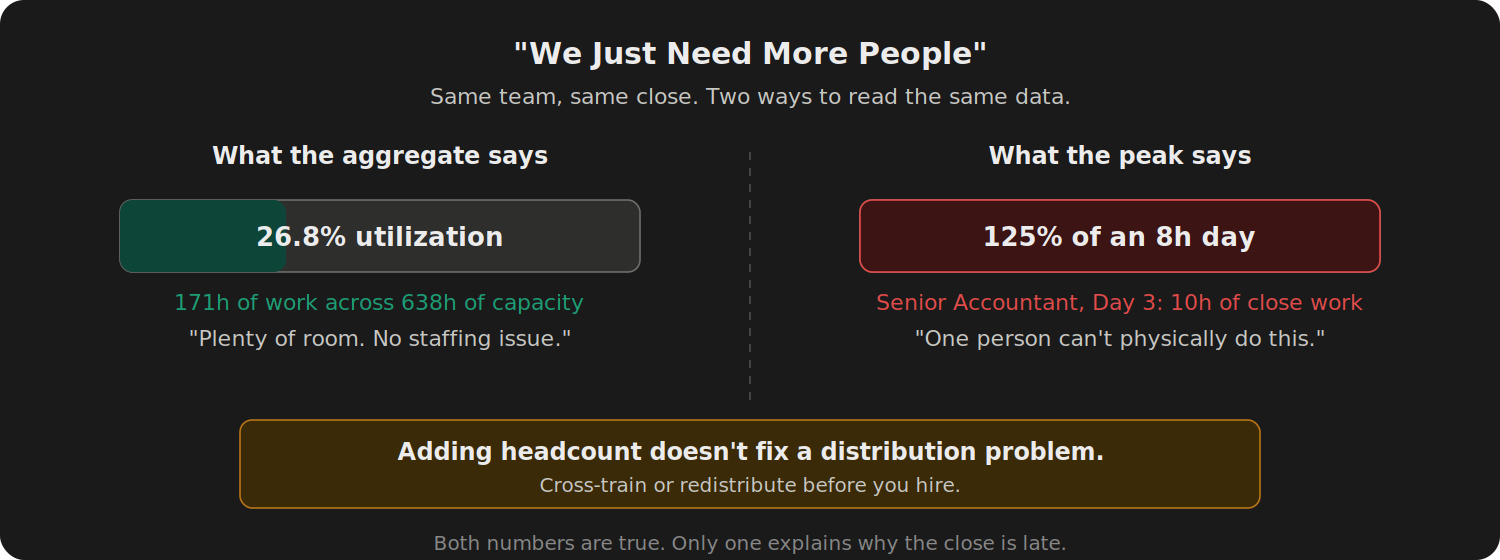
Senior Accountant, Day 3: 10 hours of close work against an 8-hour workday. And that's before any non-close responsibilities. Day 8: half an hour. Staff Accountant, Day 2: 9.5 hours. Day 8: 1 hour. Across all roles: 171 hours of close work, 638 hours of dedicated capacity. Aggregate utilization: 26.8%.
26.8% sounds comfortable. It isn't. The Senior Accountant carries 46 of those 171 hours. Most of them pile up in three days. The aggregate says the team has capacity. The peak says one person cannot physically complete what's assigned to her on Day 3. Both numbers are true. Only one of them explains why the close is late.
In Lean manufacturing, this imbalance is called Mura: unevenness. Lean treats unevenness as a root cause of waste and overburden. The practice of smoothing it out is called Heijunka. The fix isn't telling the Senior Accountant to work faster on Day 3. The fix is moving work from the spike to the trough, or spreading it across roles so no one person absorbs the crunch alone.
One more thing about those peaks. Moving even one task off an overloaded slot helps more than you'd expect. Queues near capacity grow faster than linearly. At 70% utilization in a given slot, the wait is manageable. At 100%, every additional task makes every other task later. A modest reduction in peak load produces a disproportionate drop in wait time for everyone competing for that person in that window.
Common Pushback (and Why It Doesn't Hold)
"We just need more people." Maybe. But look at aggregate utilization first. 26.8% in this case. That's not a staffing shortage. It's a distribution problem. Adding a body doesn't help if the overload sits on one specific role during one specific window. You'd be hiring someone who's idle 90% of the close to fix a 2-day spike. Cross-training or task redistribution costs less and solves the same problem.
"We already use a close checklist, we know the order." A checklist tells you what's due. It doesn't tell you when the person assigned to it is free. You can have a perfect sequence and still have a traffic jam because three things on the checklist are due the same day to the same person. The checklist manages tasks. The resource schedule manages people.
"Our close is different every month, the schedule wouldn't hold." The structure of the close is remarkably stable. The same tasks, the same dependencies, the same general sequence. What varies is upstream timing: when other functions deliver their data. That variation is exactly what the CPM-to-RCS gap measures. If your Senior Accountant is overloaded on Day 3 in January, February, March, and April, that's not monthly variation. That's a structural constraint you've been firefighting four times instead of fixing once.
Try This Before Next Close
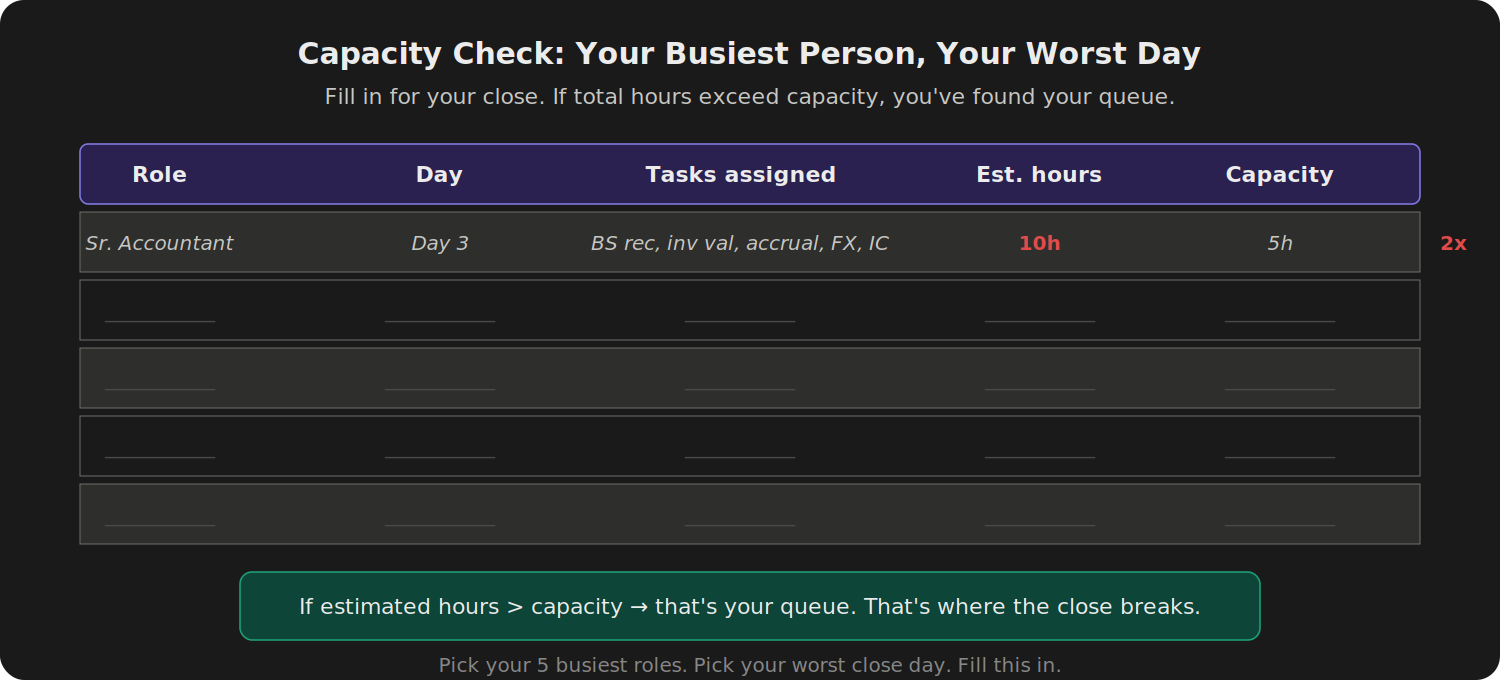
List the five people who carry the most close work. For each one, estimate how many hours per day they actually dedicate to close activities. Not total working hours. Dedicated close hours. A Senior Accountant who works 8 hours a day but spends 3 on non-close responsibilities has 5 hours of close capacity.
Now pick your worst close day. The day where everything converges. List the tasks assigned to your busiest person on that day. Add up the hours.
If the total is more than their capacity, you've found your queue. And that queue might explain why a task that takes 4 hours always finishes a day late.
What's Next
This is the fifth tool in the series. SIPOC mapped the close. Value classification sorted what to protect, simplify, and eliminate. Swimlanes exposed the handoffs. Critical path put a number on every task's buffer. This one told you whether to fix the task or fix the team.
Next: where does time actually disappear inside each task? The eight types of waste hiding in your close.
FAQ
What does the 88% CPM-to-resource ratio mean? It's the ratio of the CPM duration (theoretical minimum, assuming unlimited resources) to the resource-constrained duration (what actually happens with your team). 88% means 12% of your close timeline is pure queue time: work sitting ready while people finish something else. That 12% is recoverable without changing a single task.
How do I know which tasks to move when rebalancing the load? Start with the largest CPM-to-RCS gaps. Those are the tasks where the person was busiest when the work landed. Then check the receiving role's capacity on that day. If the Staff Accountant has 2 hours free on Day 3 and you can move a 1.5-hour reconciliation from the Senior Accountant's stack, do it. The prerequisite is that the receiving person can actually perform the task, which is why cross-training during quieter close days pays off months later.
Does this work if my team handles other work during the close? Yes, and that's exactly why dedicated close capacity matters more than total working hours. An 8-hour workday with 3 hours of BAU leaves 5 hours for the close. The resource schedule runs on that 5-hour number, not 8. Teams that don't make this distinction consistently underestimate their bottlenecks because they're comparing task hours against a capacity number that was never available.
What about tasks owned by people outside Finance? Those show up as external dependencies in the CPM, not as resource constraints you can control. You can't redistribute Procurement's workload. What you can do is track the actual delivery times of external inputs over multiple closes and build that data into the schedule. If Operations delivers inventory counts late 8 months out of 12, that's not variation. That's a structural input delay, and the CPM should reflect it.
If you want to build the full resource-constrained Gantt with per-role load views, peak detection, and the CPM-to-RCS diagnostic on all 127 tasks, that's part of Month-End Close Optimization (Run Your Close Like a System, Not a Fire Drill) on GoFast.Finance.
Sources
Resource-constrained scheduling — Brucker, P. (2007). Scheduling algorithms (5th ed.). Springer.
Heijunka and the Toyota Production System — Womack, J. P., & Jones, D. T. (2003). Lean thinking (2nd ed.). Simon & Schuster. Ohno, T. (1988). Toyota production system. Productivity Press.
Utilization, variability, and queuing — Hopp, W. J., & Spearman, M. L. (2011). Factory physics (3rd ed.). Waveland Press.
50% of finance teams take 6+ business days to close — Ledge, "The State of Month-End Close in 2025" (n=100 finance professionals, vendor survey).
APQC median close cycle time — APQC's 2017 General Accounting Open Standards Benchmarking survey found a median monthly close cycle of 6.4 calendar days, measured from trial balance to consolidated financial statements, across 2,300 organizations.
This article originally appeared in the Practical Lean Finance newsletter on LinkedIn.