- Apr 4
Your SSC Is Making Your Close Slower. And I'm Not the One Saying It.
- Arnaud Lemaire
- Accounting & Auditing
- 0 comments
This is part three of the Practical Lean Finance series. In article one, we mapped a 127-task manufacturing close with SIPOC. In article two, we classified every task as value-add, business-necessary, or waste. This one makes the invisible time visible: the handoffs between departments that nobody counts and everybody feels.
In 2025, researchers reviewed 89 studies on Shared Services Centers and looked for quantitative evidence that they actually reduce administrative costs at a company-wide P&L level. They found none. Not weak evidence. None.
Separately, Oxford University research on SSC reforms found that organizations consistently focus on production cost savings and overlook the transaction cost burden. The time burned on both sides getting to an answer that was obvious to the person in the right building.
75% of Fortune 500 companies have established shared services models. They even rebranded. Shared Services Centers carry too much deserved baggage by now, so the new label is Global Business Services. Same model. Fresh paint.
And yet, talk to the controllers at the sites. The people who actually depend on the SSC to close their books. Slow response times. The person on the other end doesn't understand the plant. High error rates. Corrections that should take two hours take a full day.
Leadership counts headcount removed. Operations counts time lost. Only one of those measures speed. And nobody is counting the handoffs.
I can show you why with one picture.
What a swimlane shows you
To see it, you need a tool that makes handoffs visible. In the previous two articles, we mapped 127 close tasks with SIPOC and classified each one as value-add, business-necessary, or waste. That told us what to protect, simplify, and eliminate.
But even after you cut the waste and streamline the compliance tasks, the close still drags. Tasks that need two hours somehow take a full day. The senior accountant finishes at 3pm and the next person doesn't start until the following morning.
The tool that makes this visible is called a swimlane. In 1990, Geary Rummler and Alan Brache published Improving Performance: How to Manage the White Space on the Organization Chart. Their thesis was simple: the biggest gains don't hide inside any department. They hide in the space between departments, at the handoff points where nobody is clearly responsible. Over 150,000 copies sold. They proved it across 250+ projects at Hewlett-Packard, 3M, Shell Oil, and Citibank.
The concept is older than that. The earliest swimlane-style process charts were documented in 1945 by the US Bureau of the Budget. Later formalized in East Germany in 1968. The idea has been around for 80 years. Most finance teams have never used one.
A swimlane diagram gives each function a horizontal lane. Tasks sit inside the lane of whoever owns them. Arrows between tasks in different lanes are handoffs. Every handoff is a point where time and context leak.
Take one process everyone knows: preparing the monthly management reporting deck. Five lanes: Finance, Operations, Sales, HR, and Management.
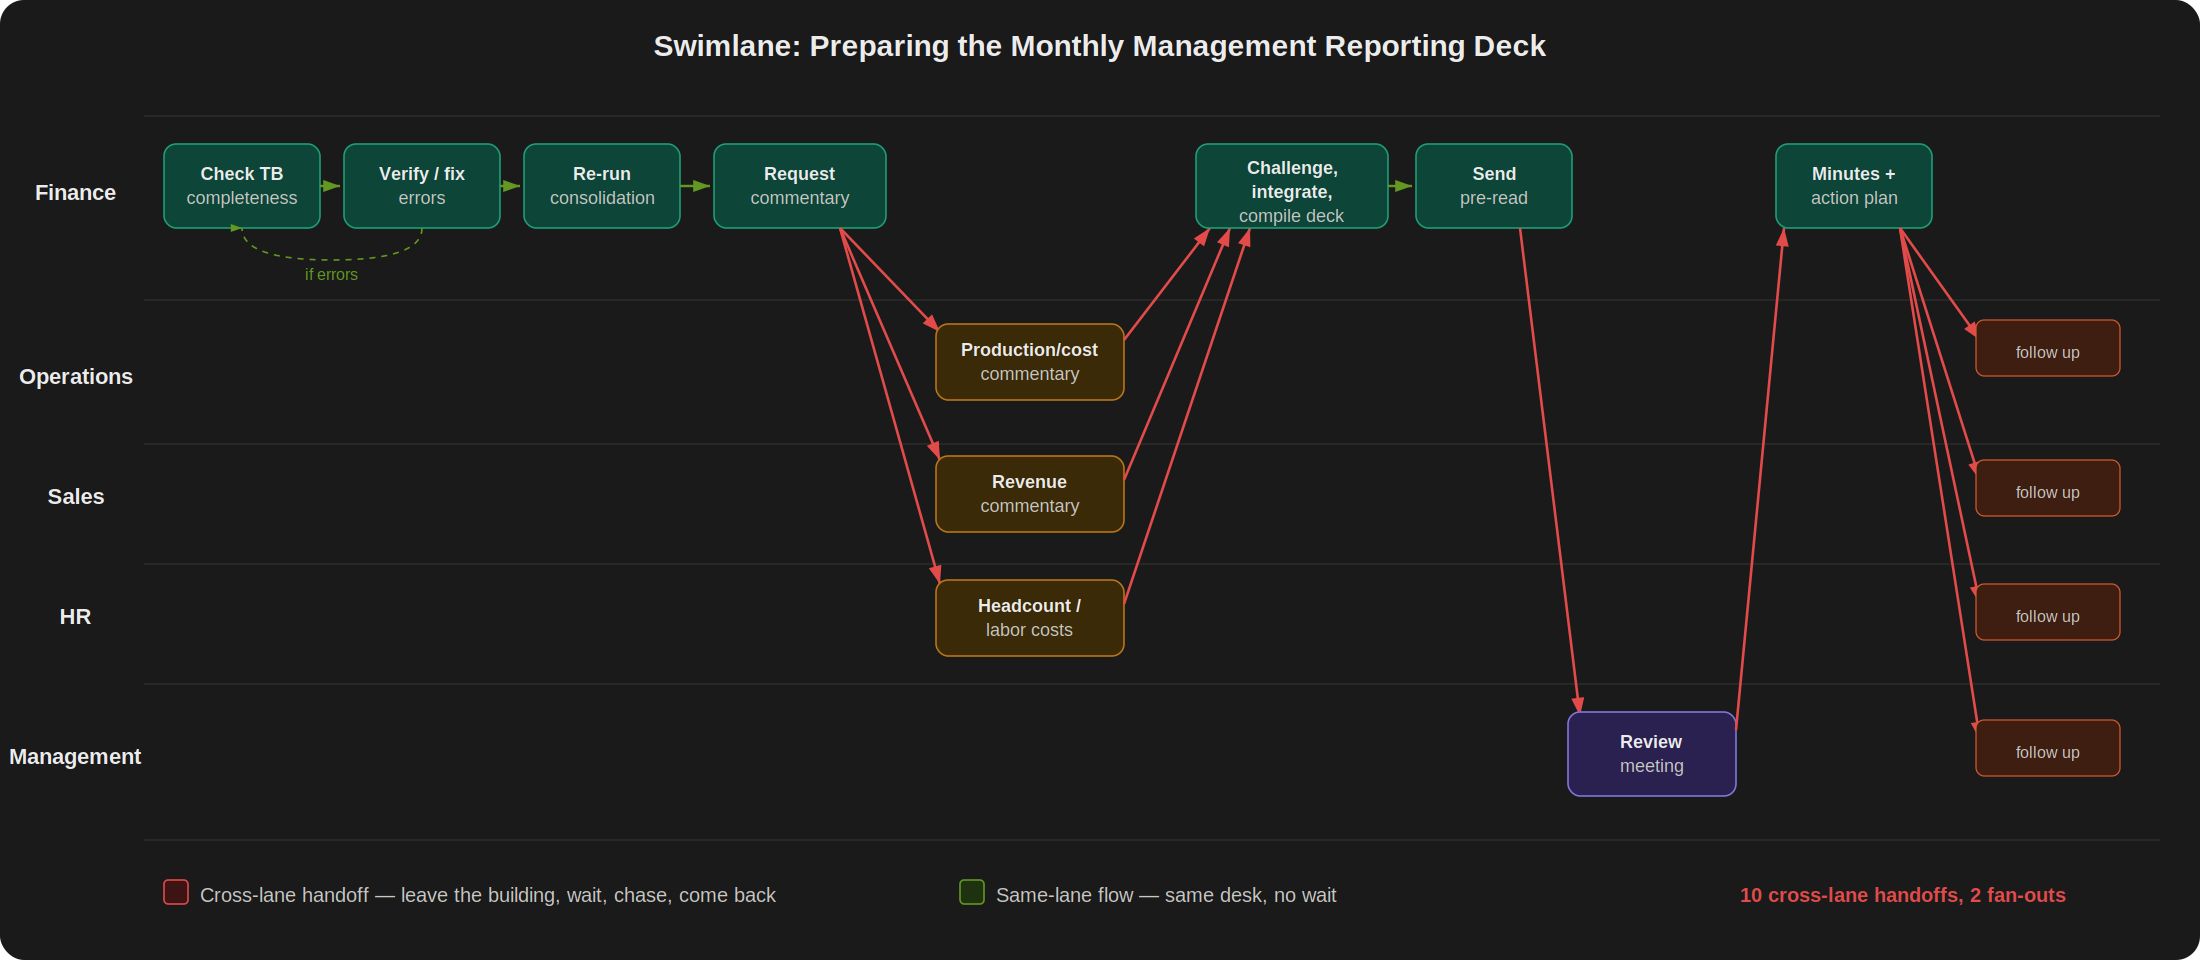
The first few tasks stay in the Finance lane. Check the trial balance. Verify completeness. Fix errors, re-run the consolidation if needed. Green arrows, same desk, no waiting.
Then Finance requests variance commentary from all functions at once. Three arrows fan out simultaneously to Operations, Sales, and HR. Each function prepares their input. Each one comes back on its own schedule. Some respond in hours, some take two days. Finance waits, chases, follows up. Three arrows fan back in, and only then can the deck move forward.
Finance compiles, challenges the inputs, integrates everything into the draft. Same desk again. Then the deck goes out for pre-read to Management. Comments come back. Finance revises. After the review meeting, minutes and action items fan out to every function again for follow-up.
Ten cross-lane handoffs in one process. Two parallel fan-outs. The actual Finance work adds up to a day or two. The process takes a week because of the crossings.
When I mapped a full 127-task manufacturing close this way across ten functional lanes, the same pattern repeated in every phase. The tasks that took the longest weren't the hardest. They were the ones with the most handoffs.
Think of it as buildings
When I show the swimlane to people, it takes a minute to click. The problem is that swimlanes look clean. Neat lanes, tidy arrows, orderly flow. On paper, crossing from one lane to another looks almost effortless, like stepping over a line. It doesn't feel expensive. It doesn't feel like a problem. That's why people draw process maps with lane changes everywhere and never question the cost.
What clicks faster is a different image.
Every function in your organization is a building. Finance is one. Operations is another. Procurement, Sales, HR, Legal, Treasury, each its own. Inside each building, roles sit on different floors. AP is on the third floor. The controller is on the fifth.
When a task finishes and the next one starts, three things can happen.
Same role: you hand the file to your colleague at the next desk. Same floor, three meters away. No penalty.
Same function, different role: you take the elevator, find the right person, confirm they understand what they're looking at. Same building, same systems. Moderate penalty.
Different function: you leave the building entirely. Print the document, attach instructions because they don't speak your language, walk across the street, enter the other building, find the right person, check twice. Maximum penalty.
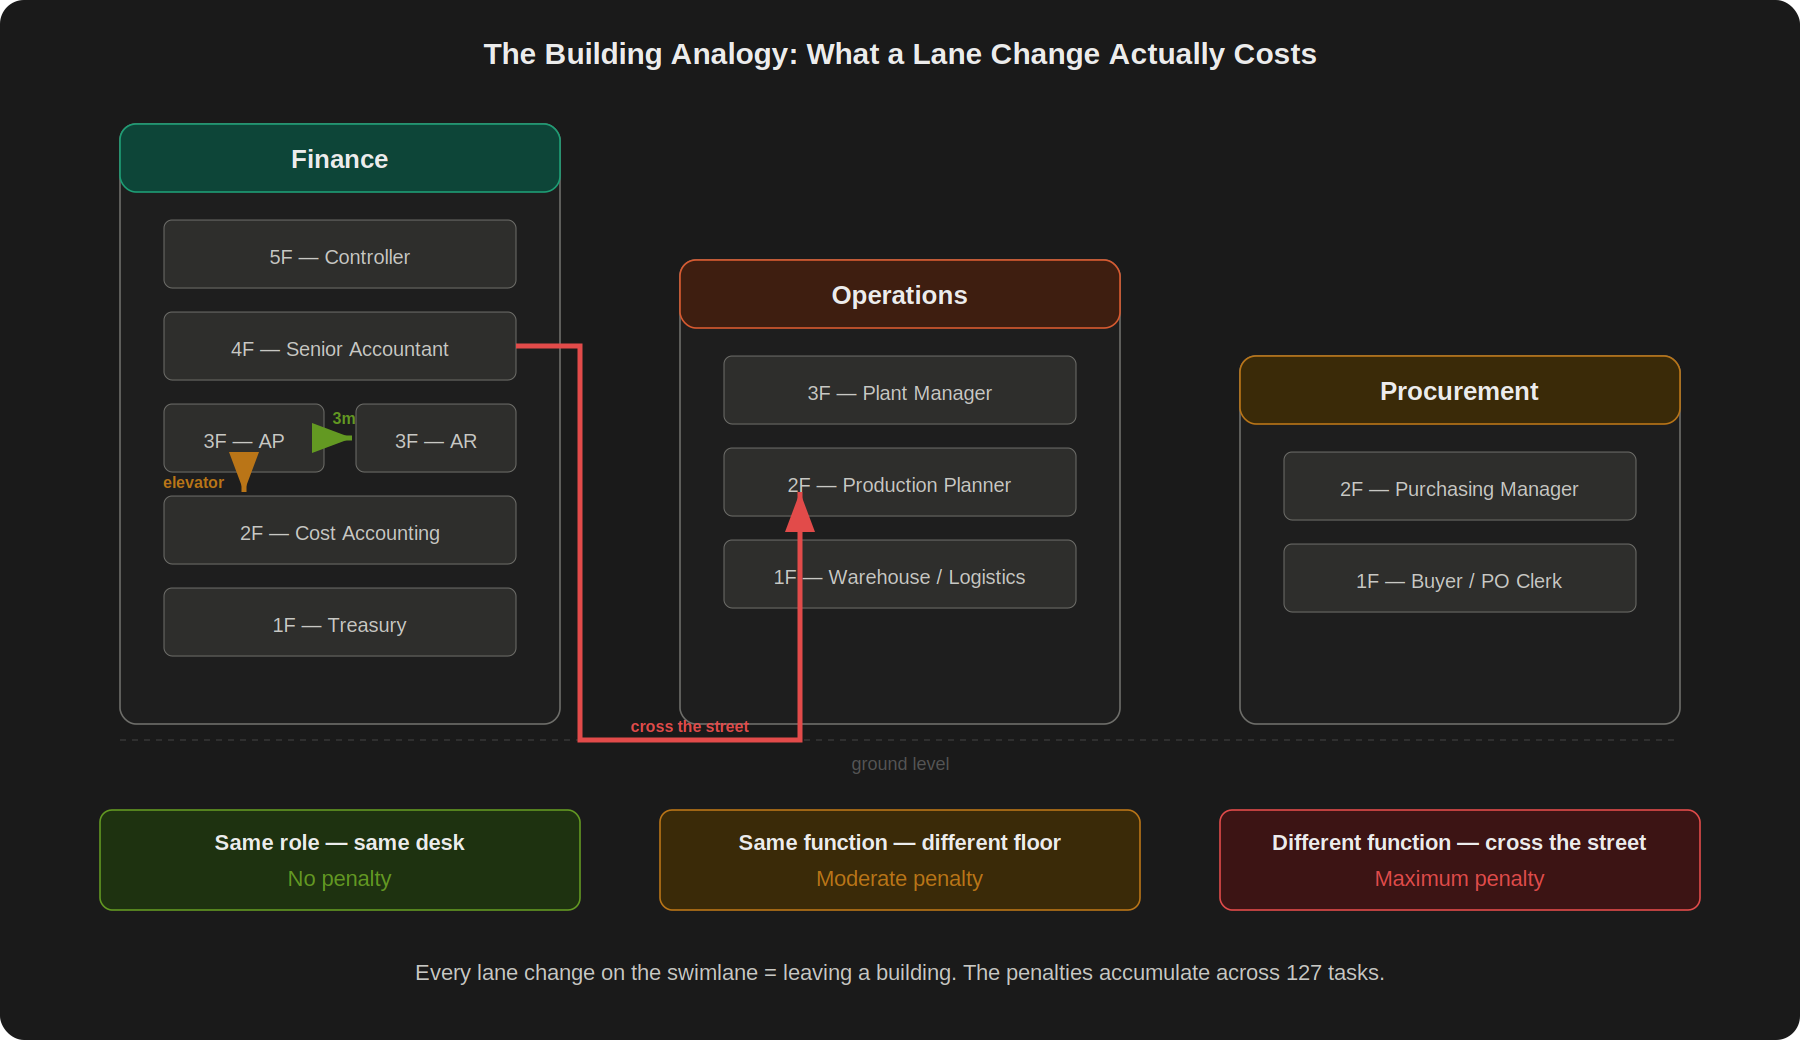
In the course, this becomes a formula. Each task gets a penalty based on the distance between the current owner and the next: zero if it stays with the same person or role, moderate if it stays in the same function but changes role, maximum if it crosses to a different function. The penalties accumulate across 127 tasks. When you see the total, you understand why data collection takes five days when the actual work adds up to a few hours.
Now flip the image. During the month-end close, you're the one visiting every building, riding every elevator, chasing every file. Data not ready? Walk back empty-handed. Try again tomorrow. 56% of finance teams name dependency on other departments as their number one close blocker (Ledge, 2025). Not bad data. Not missing skills. Other people.
Now add the SSC building
Take that picture. Every function already has its own building. The handoffs between them cost time. But at least they're across the street. Same city. Same language. Same working hours. You can walk over and sort it out face to face if you need to.
Now add the SSC. A new building. Not across the street. Across the continent. Different time zone. Different language. Different incentives. And you just routed every correction, every recurring entry, every reconciliation through it.
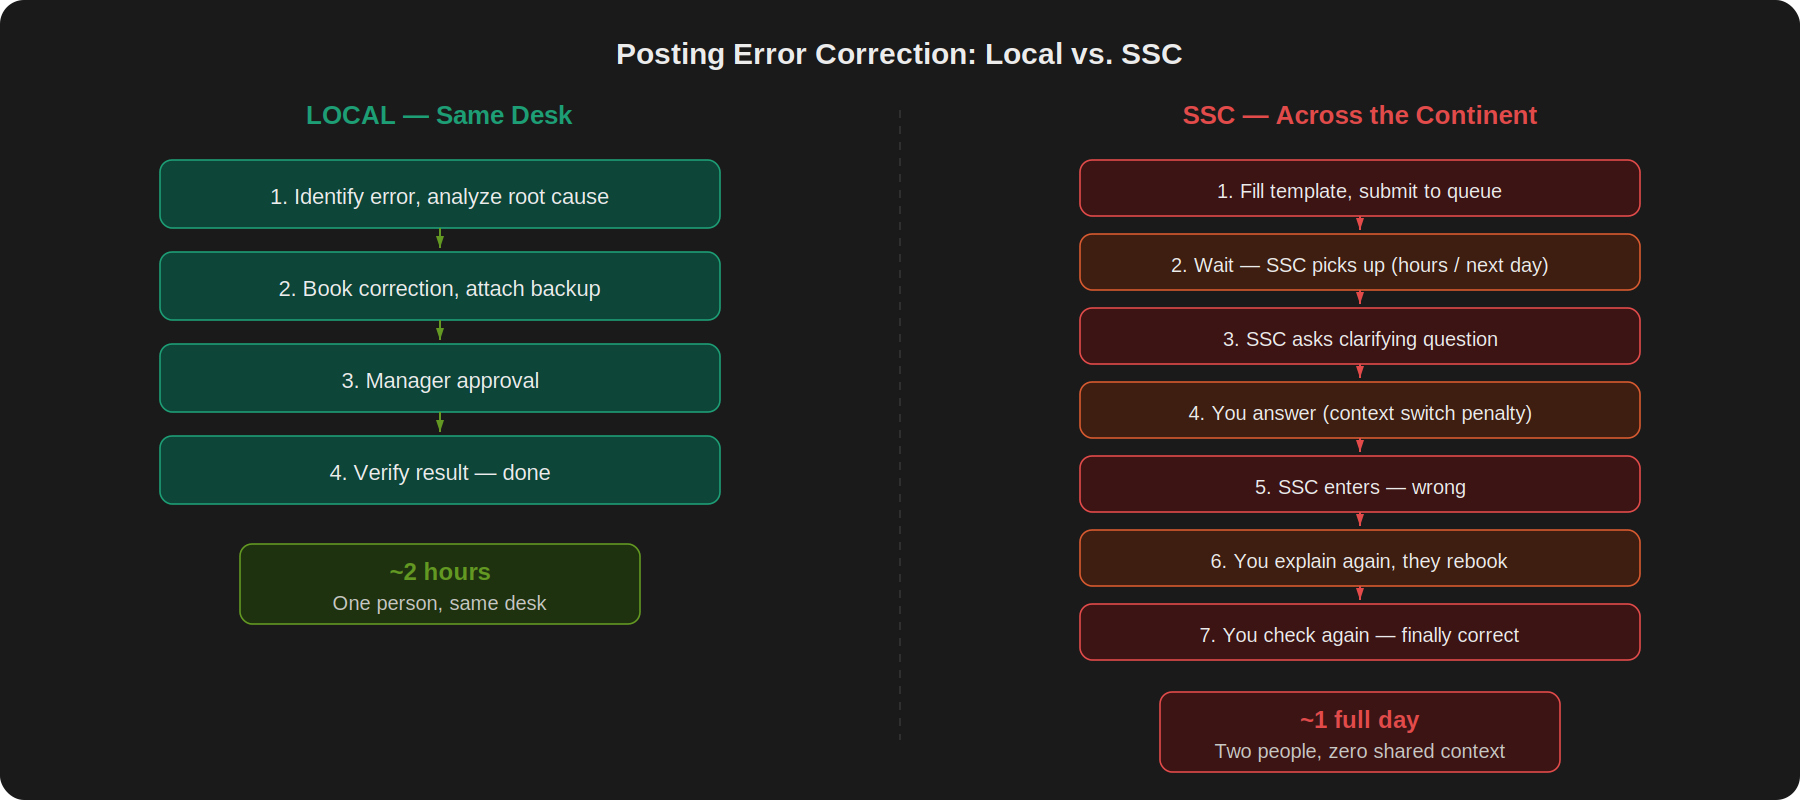
You find a posting error. In a local setup, you'd analyze it, book the correction, attach backup, get your manager's approval, and check the result. One person, same desk, maybe two hours.
With the SSC, you can't book it yourself anymore. You fill in a template. Submit it to the queue. Wait. Someone picks it up, maybe today, maybe tomorrow. They don't know your plant. They don't know why cost center 4120 is split across two production lines. They ask a clarifying question. You answer, but you've moved on to something else by then. They enter it. You check. Wrong. You explain again. They rebook. You check again.
What should have been two hours took a full day. Not because either person is incompetent. Because you added a handoff to someone who has never set foot in your building and has zero context for the correction they're making.
If your ERP was never properly configured, if upstream functions make mistakes (that's life), this pattern repeats dozens of times a month. The SSC was supposed to absorb the volume. Instead it turned every same-floor task into a cross-country trip.
On the swimlane, it's obvious. On the slide deck, it's invisible.
The same thing happens in HR
Finance isn't the only function where this breaks. Ask anyone in HR who has dealt with a regional SSC on country-specific payroll.
An employee in Switzerland changes from 100% to 80% work schedule. Locally, your HR admin knows that means adjusting the BVG pension contribution tier, recalculating the accident insurance premium split, updating the cantonal tax-at-source bracket, and filing the change with the Ausgleichskasse. Ten minutes of work for someone who has done it before and knows the local system.
Route it through an SSC in Krakow or Manila, and the person on the other end has a template. The template covers the standard fields. It doesn't cover the BVG tier logic, the cantonal tax rules, or the fact that Swiss social contributions change every January. They process what they can. Something gets flagged. It bounces back. The local HR person reviews, corrects, re-submits. The employee gets a wrong payslip. Payroll gets reopened. The correction creates a delta in the next period's social contribution filing.
One schedule change. Three rounds of corrections. Two people doing the work that one person used to do in ten minutes.
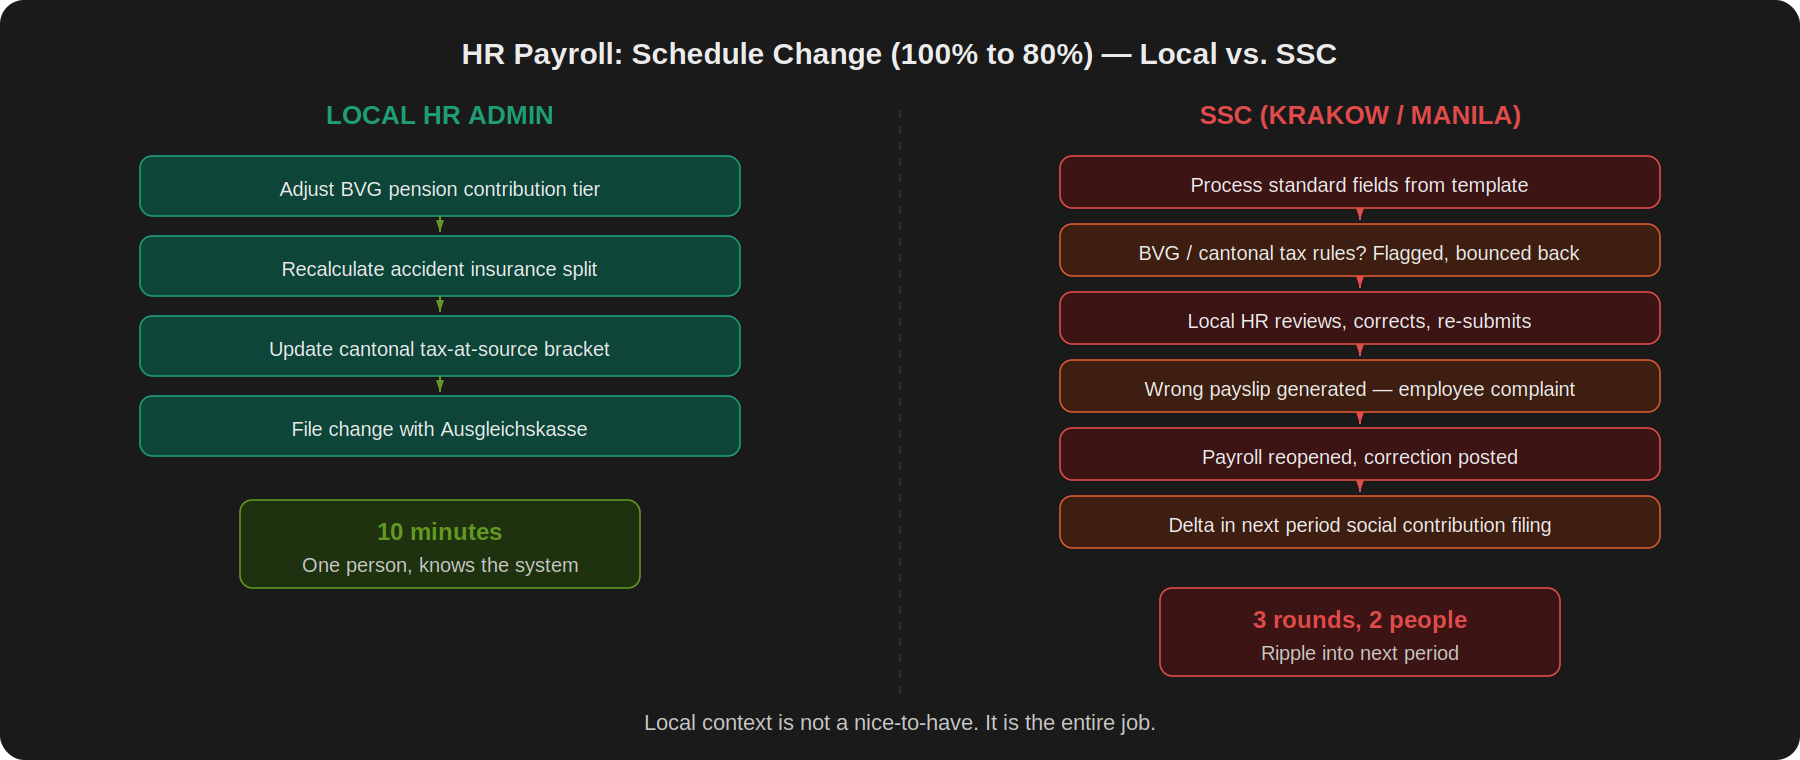
The person in the SSC isn't the problem. They're doing exactly what the process asks them to do. The process is the problem. You took a same-floor task and turned it into a cross-country trip, for a transaction where local context isn't a nice-to-have. It's the entire job.
It gets worse over time
The person in the SSC doesn't just lack context about your plant or your country. They might not be there next quarter. Deloitte found that SSCs experiencing 20%+ annual turnover tripled between 2015 and 2017. The person you trained last quarter is gone. Now you need to find who replaced them, explain the same context again, and hope they stay long enough to get it right.
Meanwhile, your local teams lose the ability to handle their own scope. The skill walks out of the building. Not because you fired anyone, but because you stopped asking them to do the work. A year later, nobody remembers how the local process worked before the SSC existed. You've created a dependency that can't be unwound without rebuilding the knowledge from scratch.
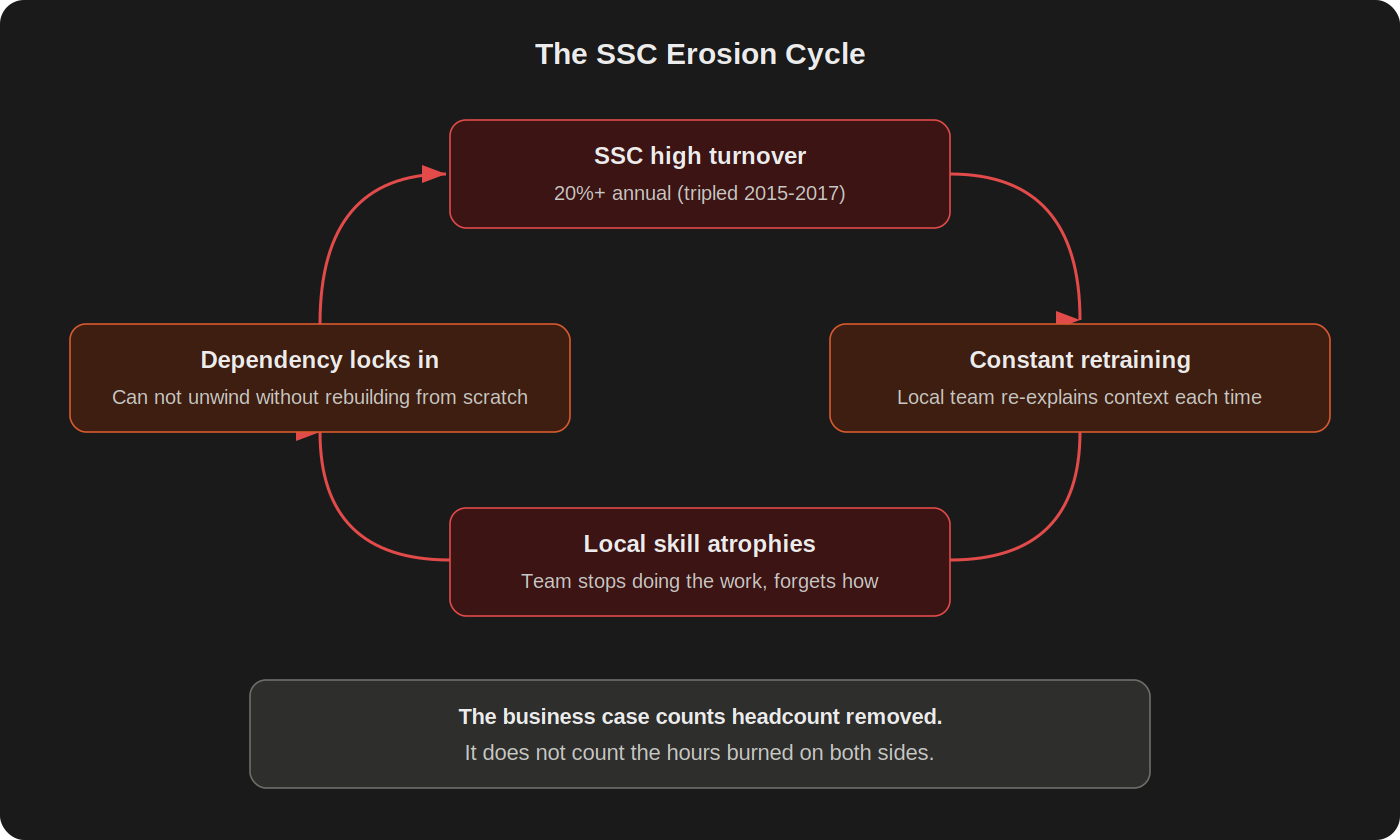
The real failure is measuring the wrong thing. The business case counts headcount and cost per transaction. It doesn't count the hours burned on both sides. The escalations, the re-explaining, the wrong payslips, the reopened periods. Those don't appear on the slide deck.
Why this doesn't get likes
This article is politically uncomfortable. Nobody wants to like a post that says their organization made a structural mistake. The controllers at the sites read it and nod, but they won't engage publicly. Leadership approved the business case. The SSC teams are doing their best inside the model they were given. So everybody scrolls past.
But silence doesn't make the handoffs disappear. And the 89 studies reviewed by Goth et al. didn't find the savings either. If the savings are real, someone should be able to show the numbers by now.
This article doesn't say SSCs can never work. It says the way most organizations have implemented them, as a 50/50 split that maximizes handoffs by design, creates more coordination cost than it removes. The swimlane shows it. The question is whether anyone in a position to act wants to look.
So what's the alternative?
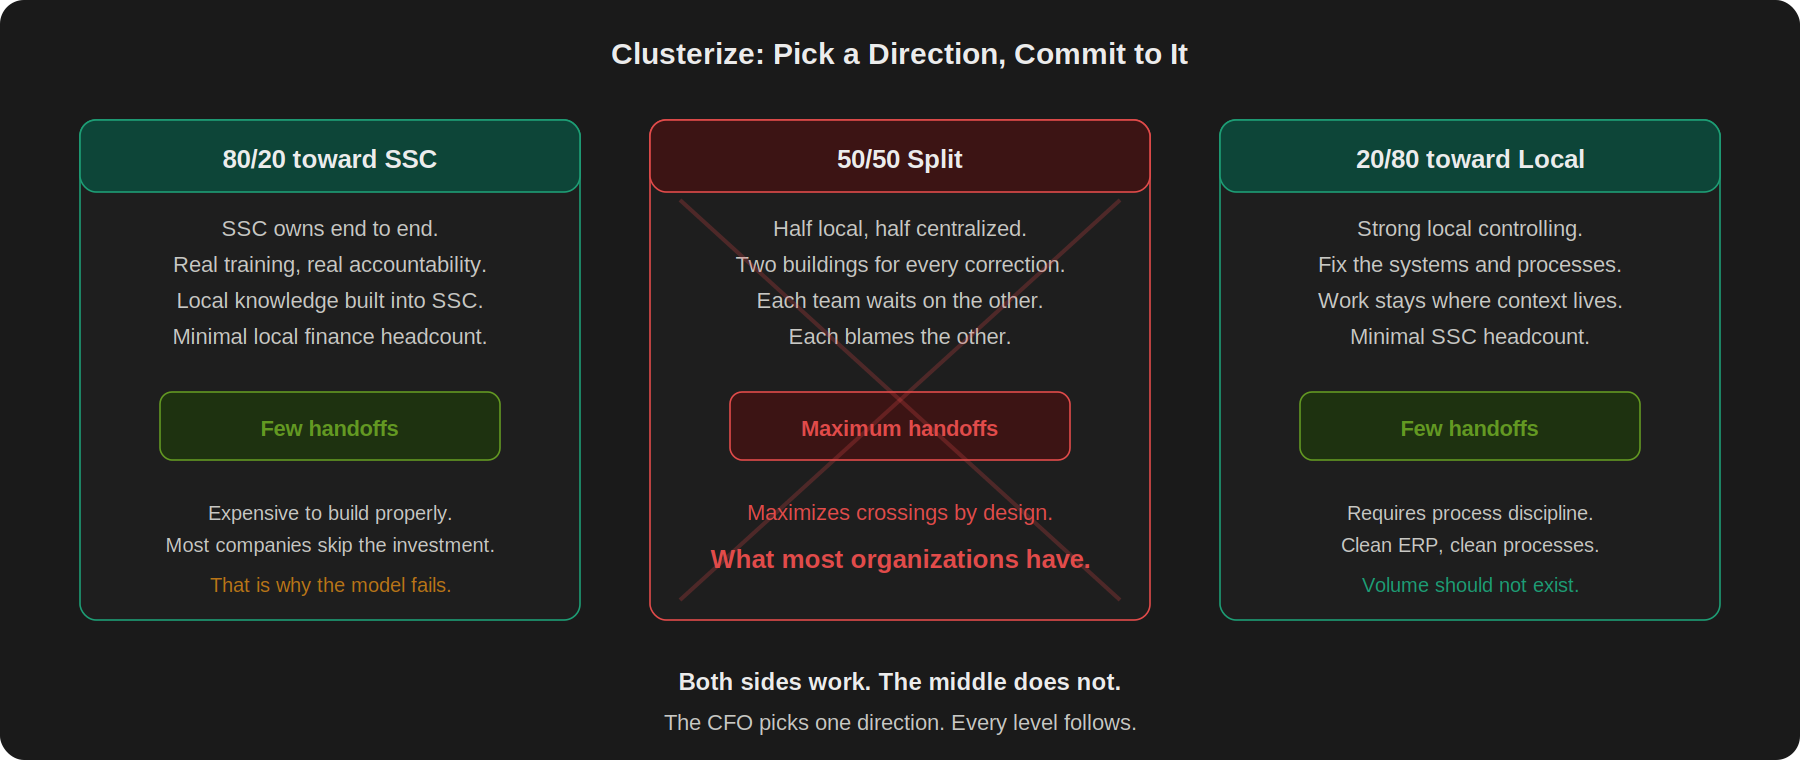
The answer is simpler than the business case makes it look: clusterize activities to reduce handoffs.
Commit to a strategy and align the organization behind it. Either you go 80/20 toward the SSC: cut most of local finance and build the SSC properly. Real training. Real accountability. Accept that the SSC owns the work end to end. Invest in local knowledge inside the SSC so the person booking your corrections actually understands your plant, your country, your chart of accounts. That costs real money. Most companies skip it, which is why the model fails.
Or you go 20/80 toward local. Cut most of the SSC, keep strong local controlling, fix the systems and processes that generated the manual work in the first place. The work stays where the context lives. If your ERP is configured properly and your processes are clean, you don't need a shared service to absorb the volume because the volume shouldn't exist.
Both require commitment from the top and clarity all the way down. The CFO picks one direction and every level follows.
What doesn't work is 50/50. Half local, half centralized. Two buildings for every correction. A 50/50 split maximizes the crossings by design. Two teams, each waiting on the other, each blaming the other when the numbers are late. That's what most organizations have.
Try this before next close
Pick one phase of your close, whichever feels slowest. List every task. For each one, write down which function owns it. Every time the function changes between consecutive tasks, mark it. Count the marks.
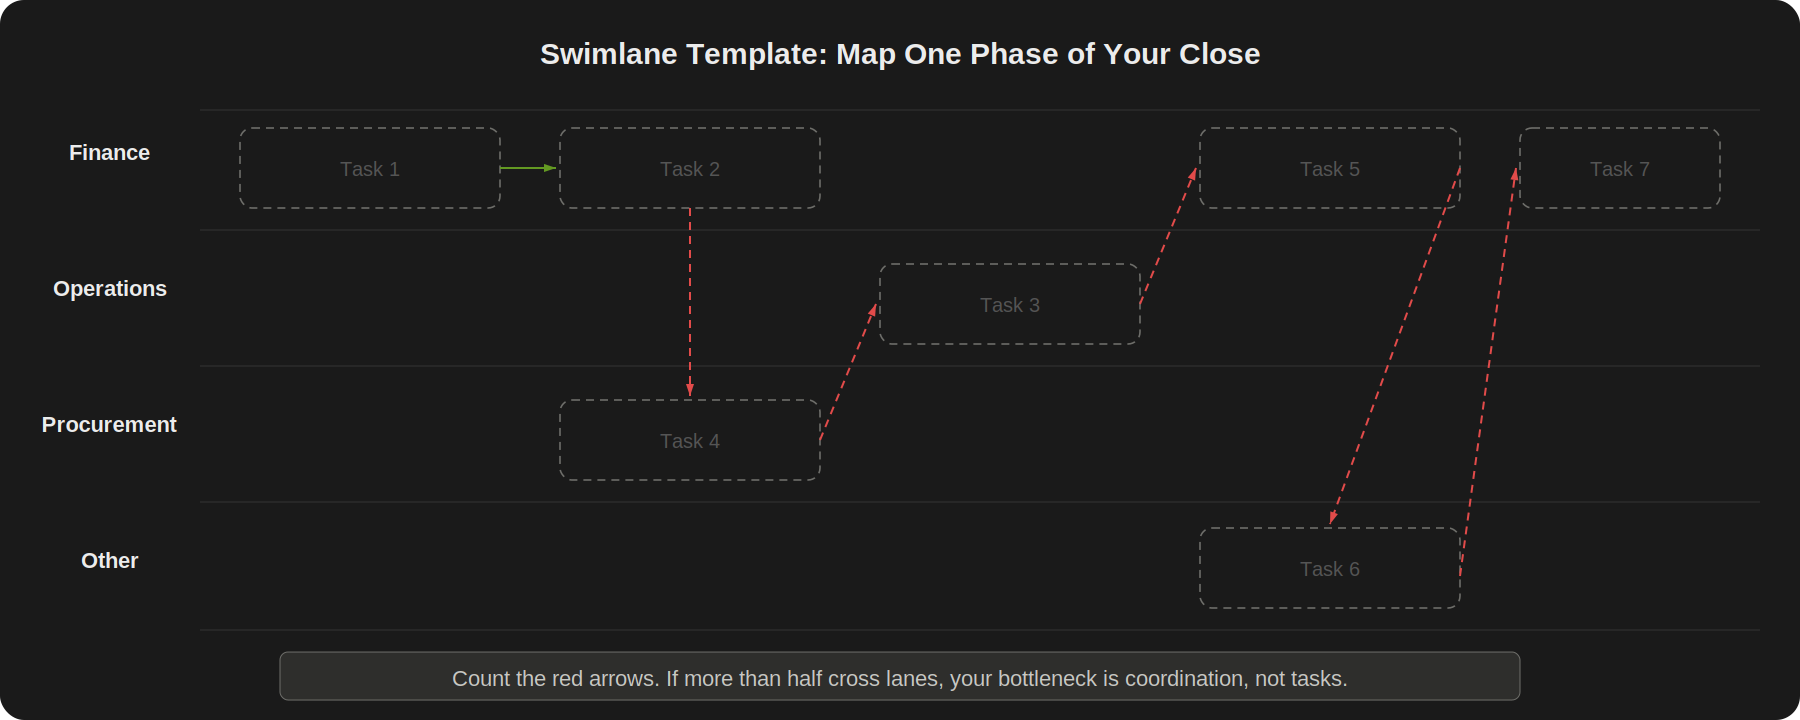
If more than half the transitions involve a function change, your bottleneck probably isn't any single task. It's the coordination overhead of crossing lanes. And if your organization has a Shared Services Center, draw the swimlane for that too. You might not like what you see.
One phase won't fix your close. But it will change what you think is slowing it down.
What comes next
The SIPOC article mapped the close. The classification article told you what to protect, simplify, and eliminate. This one showed you where the invisible time hides: in the crossings between departments. Next week: when the same task breaks every month, how do you find the actual cause instead of patching the symptom?
If you want to map all 127 tasks across ten functional swimlanes with handoff penalties and auto-calculated crossing costs in a working Excel model, that's Lesson 4 of the Month-End Close Optimization course on GoFast.Finance.
→ Month-End Close Optimization: 10 lessons, one working system
Frequently asked questions
What is a swimlane diagram and why does it matter for finance?
A swimlane diagram is a process map where each function or department gets its own horizontal lane. Tasks sit in the lane of whoever owns them, and arrows between lanes show handoffs. For finance, it matters because even a single process like preparing the monthly reporting deck involves five functions and ten lane changes. The actual Finance work takes a day or two. The process takes a week because every lane change means waiting on someone in another building. A regular task list doesn't show that. The swimlane does.
Why is my month-end close so slow even after we automated?
Automation speeds up individual tasks. It doesn't remove the wait time between them. If your consolidation accountant finishes at 3pm but the next person in the chain doesn't start until the next morning because they sit in a different function, automation saved you nothing on that gap. The close drags because of coordination overhead between departments, not because any single task takes too long. The Ledge 2025 survey found that 56% of finance teams name dependency on other departments as their top blocker. Draw the swimlane and you'll see where the gaps actually are.
Do Shared Services Centers actually save money?
The honest answer is: nobody has proven it at the total cost level. A 2025 systematic review of 89 SSC studies (Goth, Catala-Perez & Hedderich) found no solid quantitative evidence that SSCs reduce administrative costs when measured at the company-wide P&L. The business cases count headcount removed and cost per transaction. They don't count the coordination cost created: the re-explaining, the corrections, the escalations, the local expert who still gets called anyway. Oxford research (Elston & MacCarthaigh, 2016) found the same gap. Organizations count production costs and miss the transaction costs.
How do I reduce handoffs in the month-end close?
Clusterize. Group consecutive tasks so they stay within the same function or the same role as long as possible. If your pre-close phase involves ten tasks that bounce between five departments, see which of those can be consolidated, resequenced, or reassigned so fewer lane changes happen. The goal isn't zero handoffs. It's fewer unnecessary ones. Sometimes a task sits in the wrong lane because "that's how we've always done it," not because there's a real reason. The swimlane makes those visible.
Sources
Ledge, "The State of Month-End Close in 2025" — 100 finance professionals surveyed. 56% cite dependency on other departments as top close blocker. 50% take 6+ business days to close.
Rummler, G. A. & Brache, A. P. (1990/1995). Improving Performance: How to Manage the White Space on the Organization Chart. Jossey-Bass. Over 150,000 copies sold. 250+ projects at Hewlett-Packard, 3M, Shell Oil, Citibank.
US Bureau of the Budget, "Process Charting: Its Use in Procedural Analysis," November 1945. Later formalized in East Germany, 1968 (TGL 22452). Source: AllAboutLean.com.
FloQast & University of Georgia, "2022 Controller's Guidebook" — 81% say month-end close disrupts personal lives.
APQC Open Standards Benchmarking — Median close cycle: 6.4 business days (n=2,300+ organizations).
Deloitte, "2017 Global Shared Services Survey" — SSCs with 20%+ annual turnover tripled between 2015 and 2017. 330+ companies, 1,100+ SSCs, 37 countries.
Goth, J., Catala-Perez, D. & Hedderich, B. (2025). "Shared service centers (SSCs) and administrative cost reduction: a systematic review and research agenda." Journal of Service Theory and Practice (Emerald Insight). Systematic review of 89 SSC articles.
Richter, P.C. & Bruhl, R. (2017). "Shared service center research: A review of the past, present, and future." European Management Journal. 75% of Fortune 500 have established shared services models.
Elston, T. & MacCarthaigh, M. (2016). "Five risks to cost saving from sharing services." University of Oxford / Blavatnik School of Government. Public Money & Management.
This article originally appeared in the Practical Lean Finance newsletter on LinkedIn.