- May 24
Your DSO Is Lying to You
- Arnaud Lemaire
- Accounting & Auditing
- 0 comments
This is Article 2 of Practical Lean Finance, Series 2 on Net Working Capital. New here? Start with Article 1: Your Cash Is Trapped. Here's Where. Coming from there? Last week we opened the cash conversion cycle and the three levers that move NWC. This week we pull the first one: receivables. The first question is whether you're even measuring it correctly.
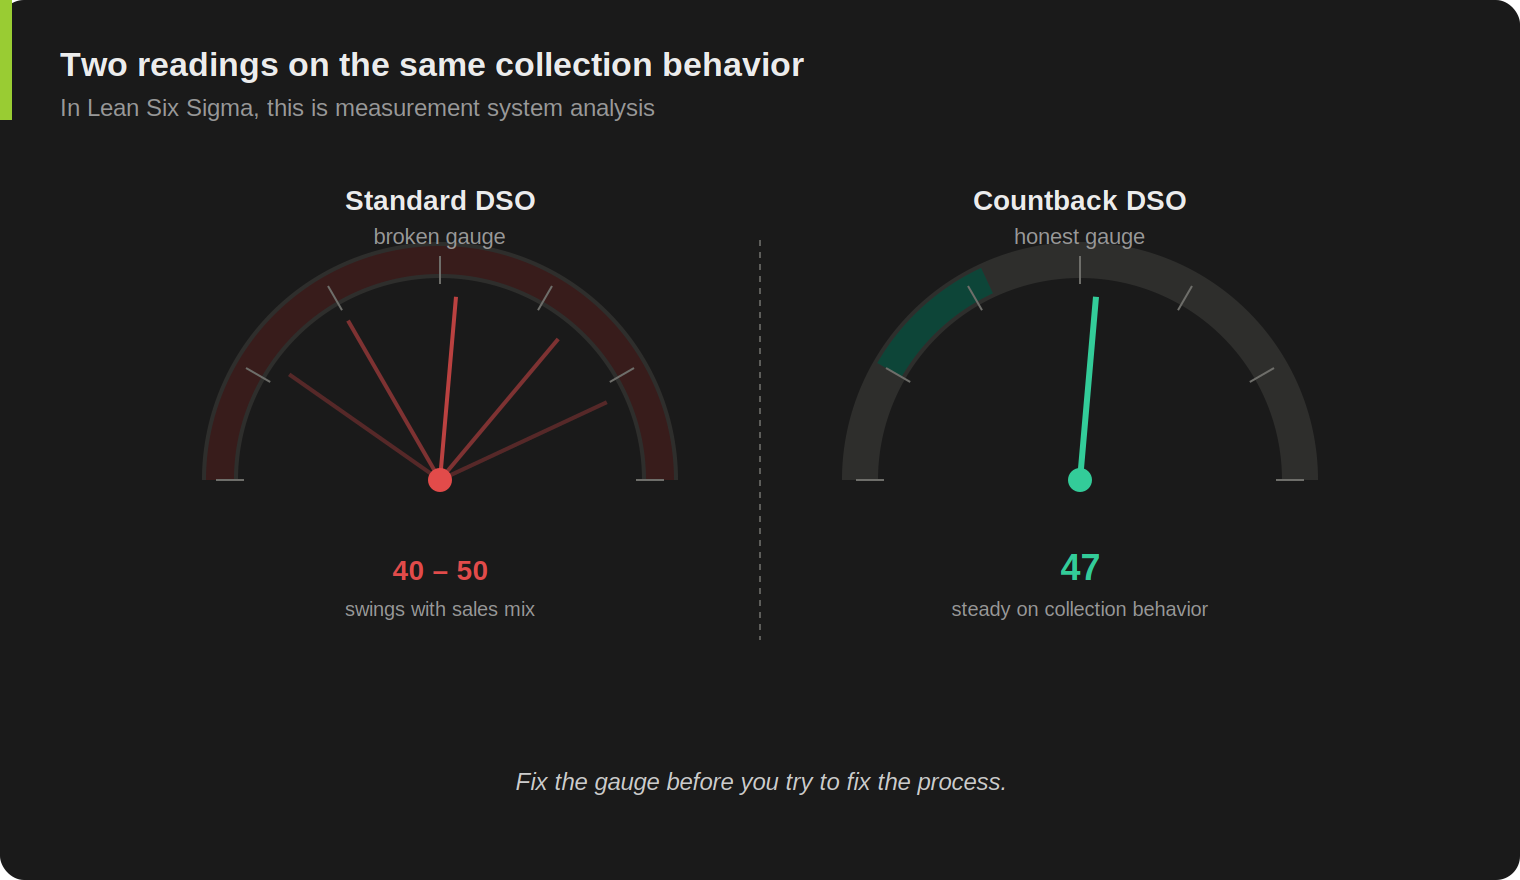
Your simple DSO says 47 days. Your terms are Net 30. You walk into the next finance meeting assuming customers are running 17 days late on average. Then someone notes revenue spiked last month from one large order, and the metric dropped. The "improvement" you saw wasn't an improvement. The math just moved because revenue moved.
If you've been reporting simple DSO to the CFO without ever calculating it a second way, you're working off a broken gauge.
By the end of this article, you'll have two ways to measure collection speed, a method that survives revenue volatility, the four adjustments that keep your numerator honest, and a single dollar figure to put on the next finance agenda.
How the Standard Formula Misleads
Most management dashboards use a version of (ending trade AR / monthly credit sales) × days in the period. The numerator is a snapshot: AR at month-end. The denominator is a rate: credit sales spread across the period. When those two move out of sync, the ratio swings for reasons that have nothing to do with how fast customers actually pay.
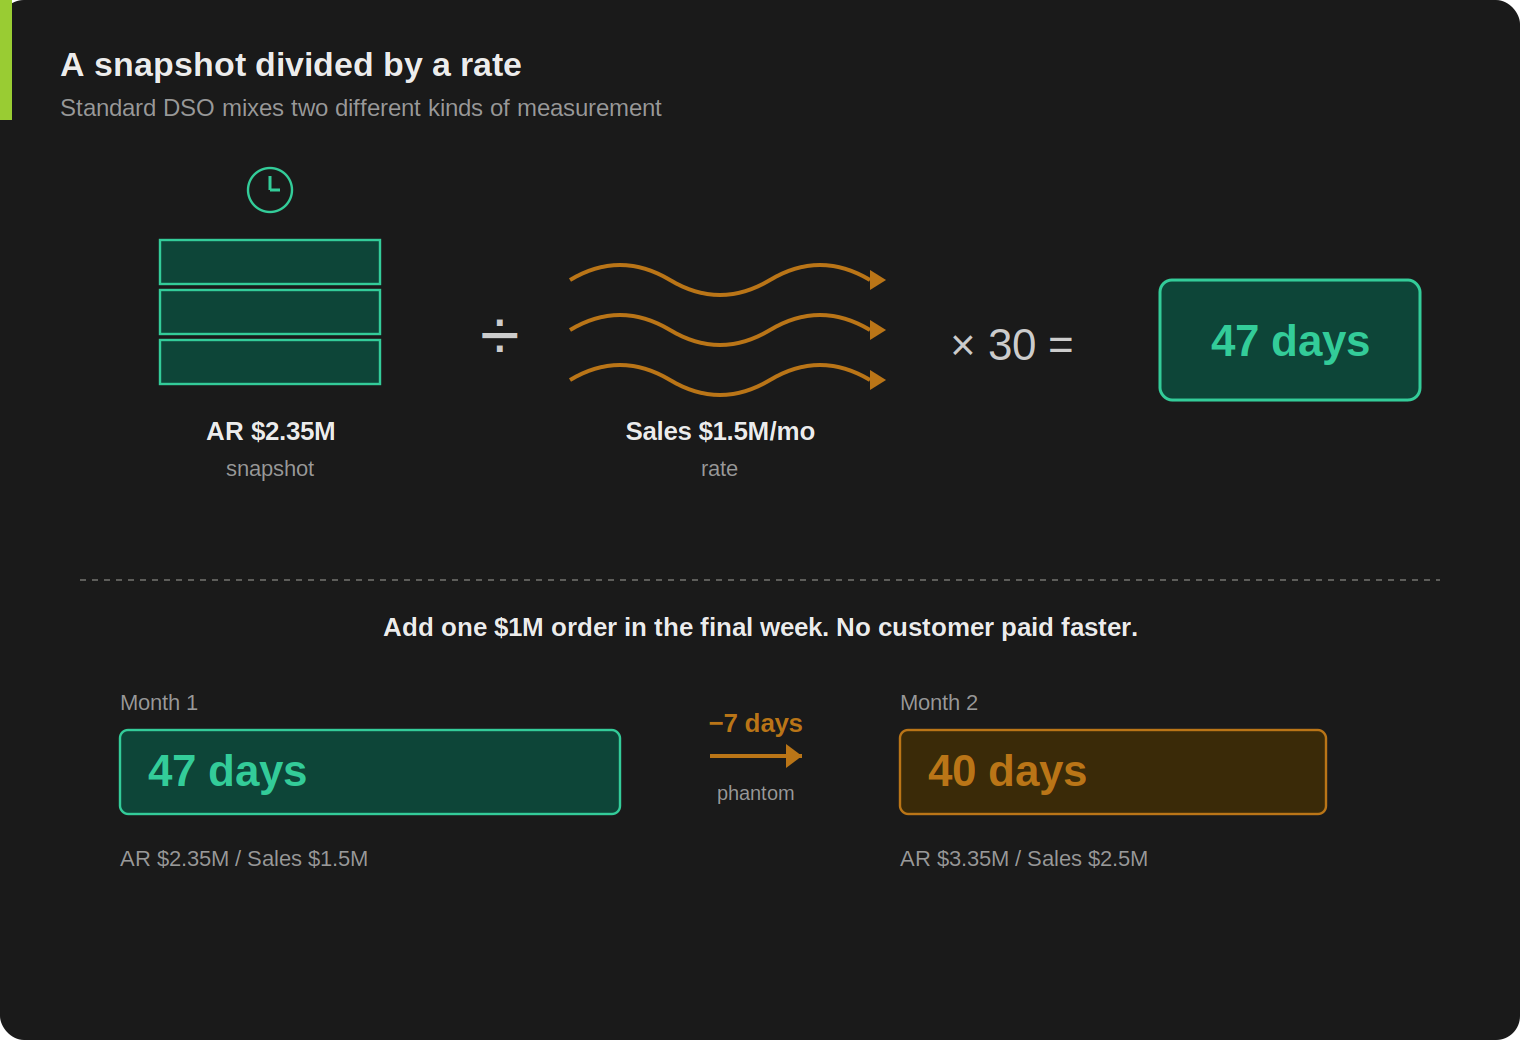
Take a B2B manufacturer with stable customer behavior. Monthly revenue is around $1.5M. Customers pay on average at 47 days against Net 30 terms. The AR balance settles around $2.35M at month-end. That's $50K of daily revenue carrying 47 days of receivables.
Standard DSO: $2.35M / $1.5M × 30 = 47 days. The gauge reads correctly. The CFO sees a 17-day overdue average and starts asking questions.
Now month two. One large customer places a $1M order, shipped in the final week of the month, on the same Net 30 terms. Total credit sales for the month are $2.5M. The new order sits in AR at month-end because it's only a few days old, nowhere near due. End-of-month AR is now $2.35M + $1M = $3.35M.
Standard DSO: $3.35M / $2.5M × 30 = 40 days.
The metric dropped seven days. The CFO sees DSO going from 47 to 40 and asks what changed. Nothing changed. No customer paid faster. The same accounts ran the same patterns. A single new order inflated the denominator, and the formula carried the noise straight to the dashboard.
If your business has predictable revenue with no large concentrated orders, standard DSO is probably fine. The further you sit from that profile, the more your gauge is lying to you. Revenue varying more than 10-15% month to month, a few customers materially larger than the rest, quarter-end shipments bunching up: any one of those breaks the formula.
Countback DSO Does the Same Job, Honestly
The fix doesn't require new software or a different system. It's a different way of consuming the same data.
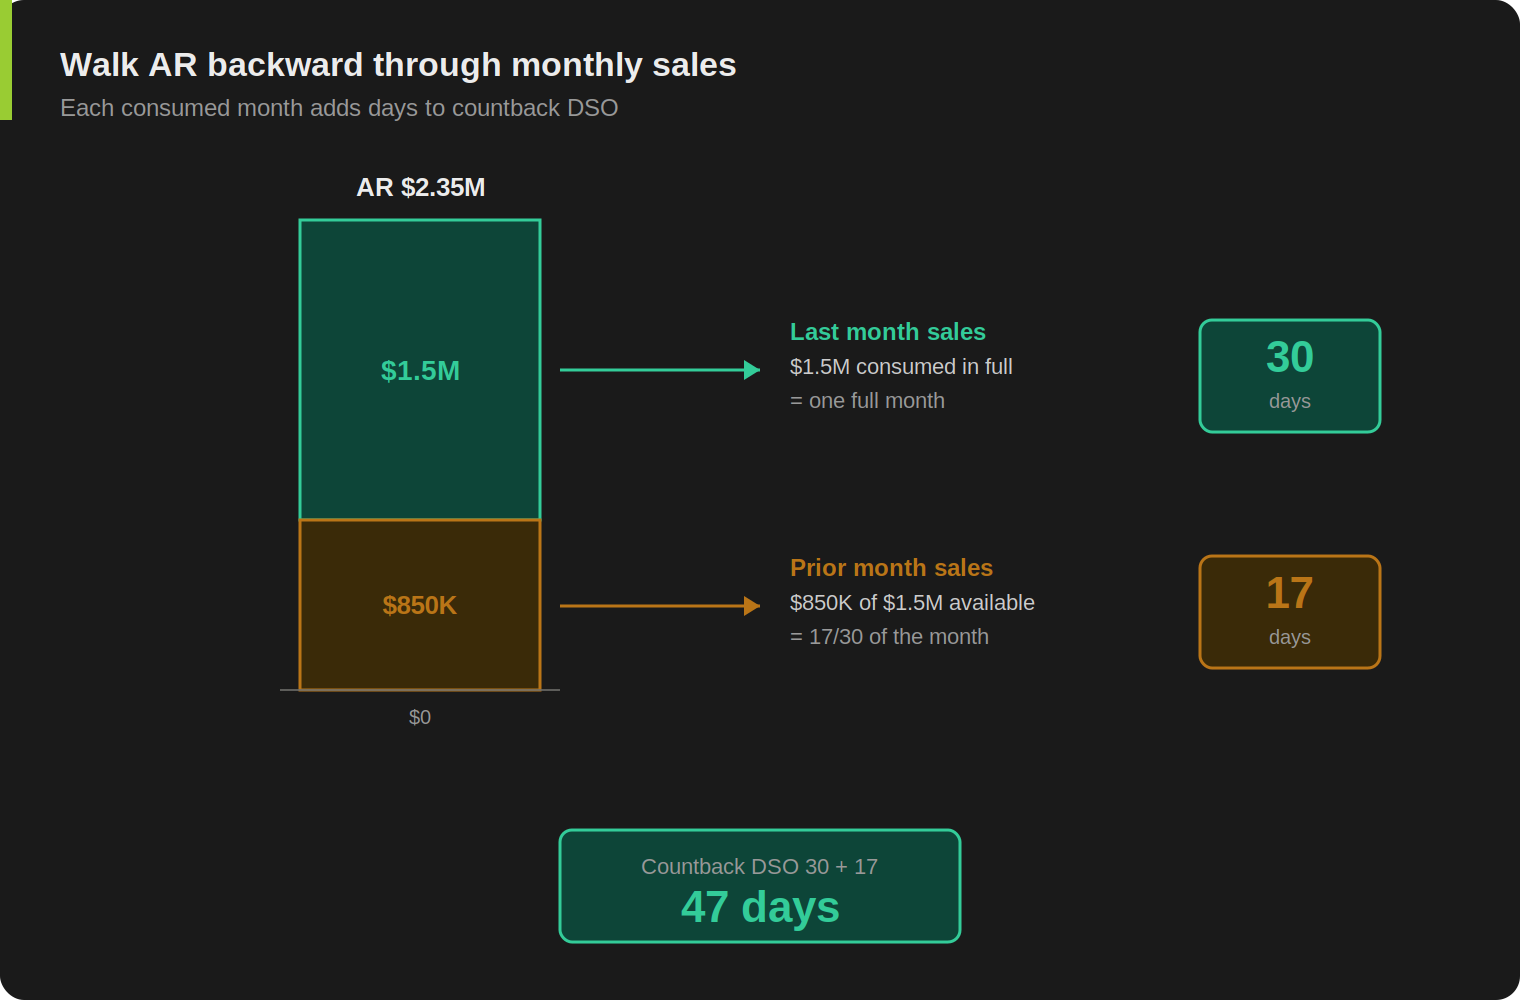
Start with AR. Walk backward through revenue, month by month. Each time you subtract a full month of revenue, you've consumed 30 days. When the remaining AR is smaller than the next month's revenue, calculate the partial month proportionally and add those days. The total is your countback DSO.
Same example, month one. AR $2.35M. Subtract last month's revenue: $1.5M, all of it. 30 days consumed. Remaining: $850K. Compare to the month before: $1.5M available, $850K consumed, 17 days. Countback DSO = 30 + 17 = 47 days. Matches simple. Nothing's distorted yet.
Month two with the big order. AR $3.35M. Subtract last month's revenue: $2.5M, all of it. 30 days consumed. Remaining $850K. Subtract the month before: $1.5M available, $850K consumed, 17 days. Countback DSO = 47 days. Stable.
Customer behavior didn't change. Countback didn't change either. The seven-day swing in standard DSO was an artifact, and the countback method tells you so without forcing you to gather new data or wait for a new system. Same AR, same revenue, different math.
The Reverse Case: When Standard DSO Hides a Real Problem
The first example showed standard DSO swinging when nothing changed. Now look at the opposite failure mode, where standard DSO stays calm while collection quietly degrades.
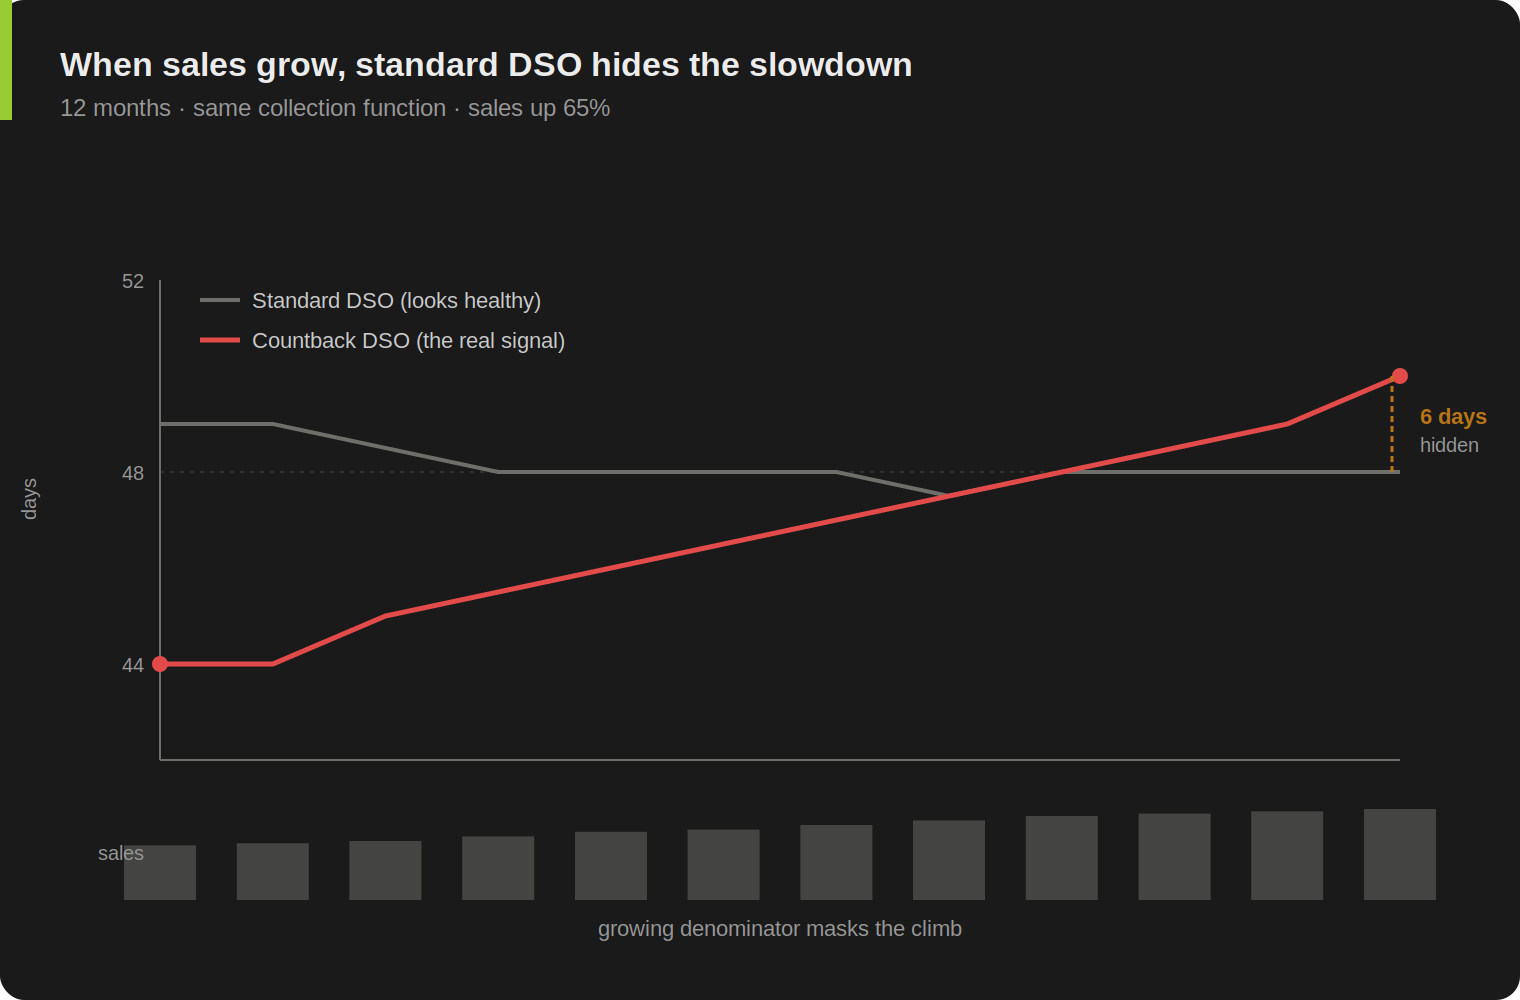
Same manufacturer profile, eighteen months later. Volume picked up. Revenue has been growing roughly 25% per quarter. Last four months of monthly revenue: $1.3M, $1.5M, $1.8M, $2.0M. The collection team didn't grow. They're handling the same number of customers per analyst, except every customer now ships more often, and the credit team approves new accounts every week. Backlog has been creeping up. Reminders are going out later. A few large customers have quietly drifted from 47-day to 60-day payment patterns and nobody's flagged it.
End-of-month AR balance: $3.2M.
Standard DSO: $3.2M / $2.0M × 30 = 48 days. Last quarter's reading was 49. The CFO sees a one-day improvement in a high-growth business and concludes the collection function is keeping up.
Countback says something different. AR $3.2M. Subtract last month ($2.0M): 30 days consumed, remaining $1.2M. Subtract the month before ($1.8M): $1.2M / $1.8M × 30 = 20 days. Countback DSO = 50 days. A year ago, before the growth phase, countback was 44. The portfolio is now carrying six more days of receivables than it was before growth started. Standard DSO never showed it.
These patterns come from B2B manufacturers I've worked with across twelve years in operational finance roles.
That six-day drift, on roughly $66K of daily credit sales, is $400K of working capital sitting at customers that the standard formula can't see. It's invisible until growth slows. When the next quarter doesn't grow, the AR balance will look suddenly heavy and the CFO will ask what happened. Nothing happened that month. The drift accumulated for a year, hidden by a growing denominator.
Countback won't tell you which customers caused the drift. It will tell you the drift is real enough to investigate. That's the next article in this series.
Standard DSO lies in both directions. It overstates collection problems when sales dip. It hides them when sales grow. Either way, you're making decisions on the wrong signal.
The Gap to Terms, in Dollars
Once countback DSO is honest, the next number to put on a CFO's desk is the gap between your collection speed and your contractual terms.
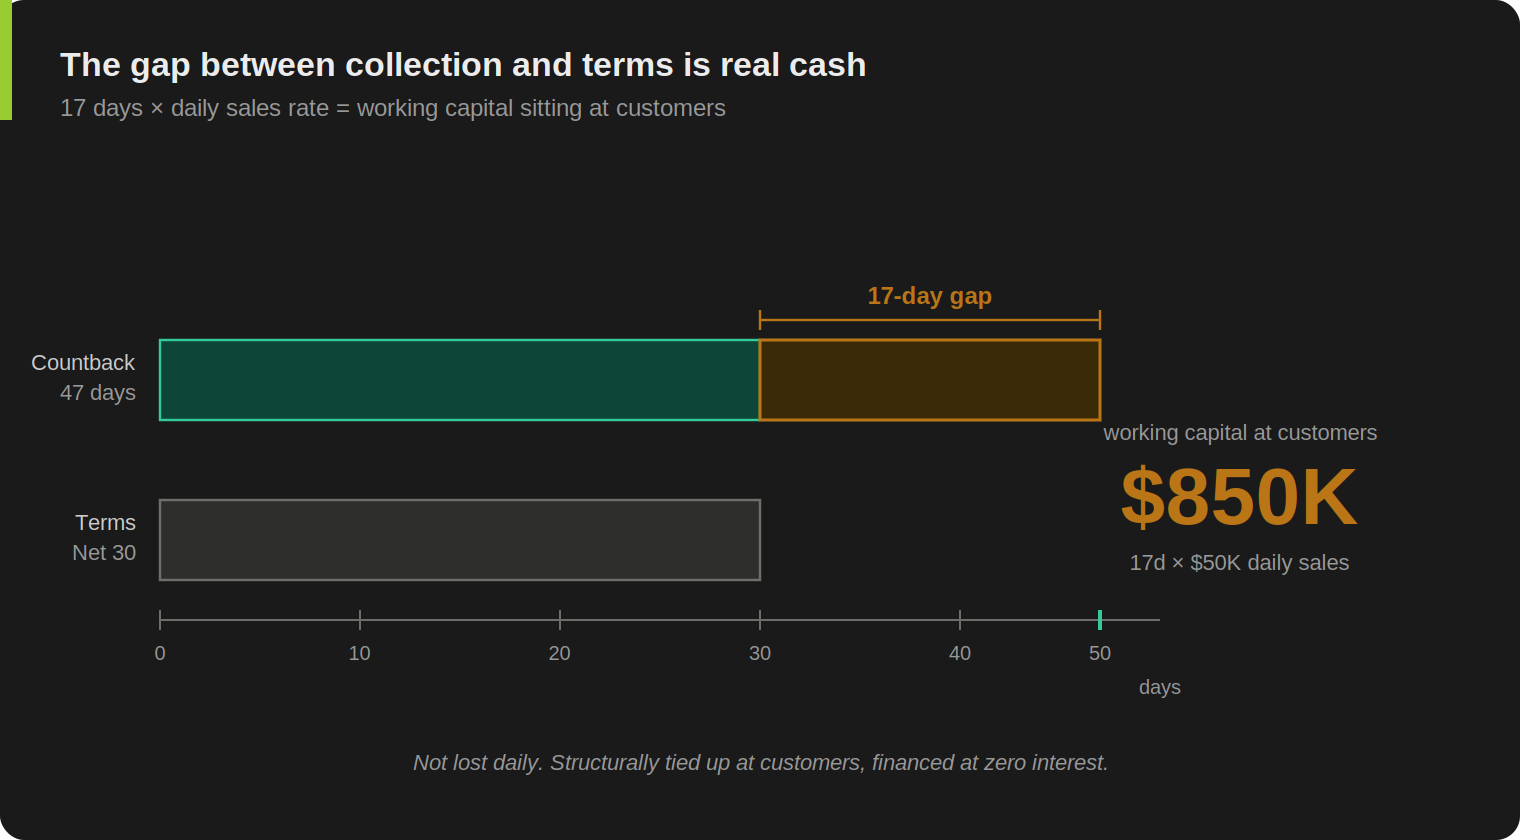
Countback DSO 47 days. Weighted average customer terms: Net 30. The weighting is by credit sales, not customer count (a $5M-a-year customer matters more than a $50K one). Gap: 17 days.
A short clarification before the dollar math, because experienced controllers will catch this otherwise. The 17 days isn't an "average overdue" number. Some invoices in the book haven't come due yet. Others are past due. The 17 days is the portfolio-level working capital gap: how much more cash the receivables book ties up relative to contractual terms. It tells you the book is heavier than it should be. Aging tells you which specific invoices are past due. You need both.
17 days × $50K daily credit sales = $850K.
At your current run rate, roughly $850K of working capital sits at customers at any given moment. As one invoice gets paid, another arrives to replace it. The balance stays around $850K because the structural gap stays at 17 days. You're extending credit at zero interest, day after day, without a board decision and without a treasurer pricing it.
A few patterns to look for when you produce that number for the first time. If the gap is small (a few days) and stable, your collections process is fine and the conversation moves to whether terms are competitive in your market. If the gap is large and stable, you have a structural issue with customer payment behavior that no amount of dunning will fix. That's a commercial conversation, not a process one. If the gap is volatile month to month, the underlying problem is process or invoicing quality, and that's where Lean diagnostics belong.
The first number is informational. The trend over six to twelve months is where the real signal sits. A widening gap is a leading indicator most finance dashboards don't show, because they don't track countback at all.
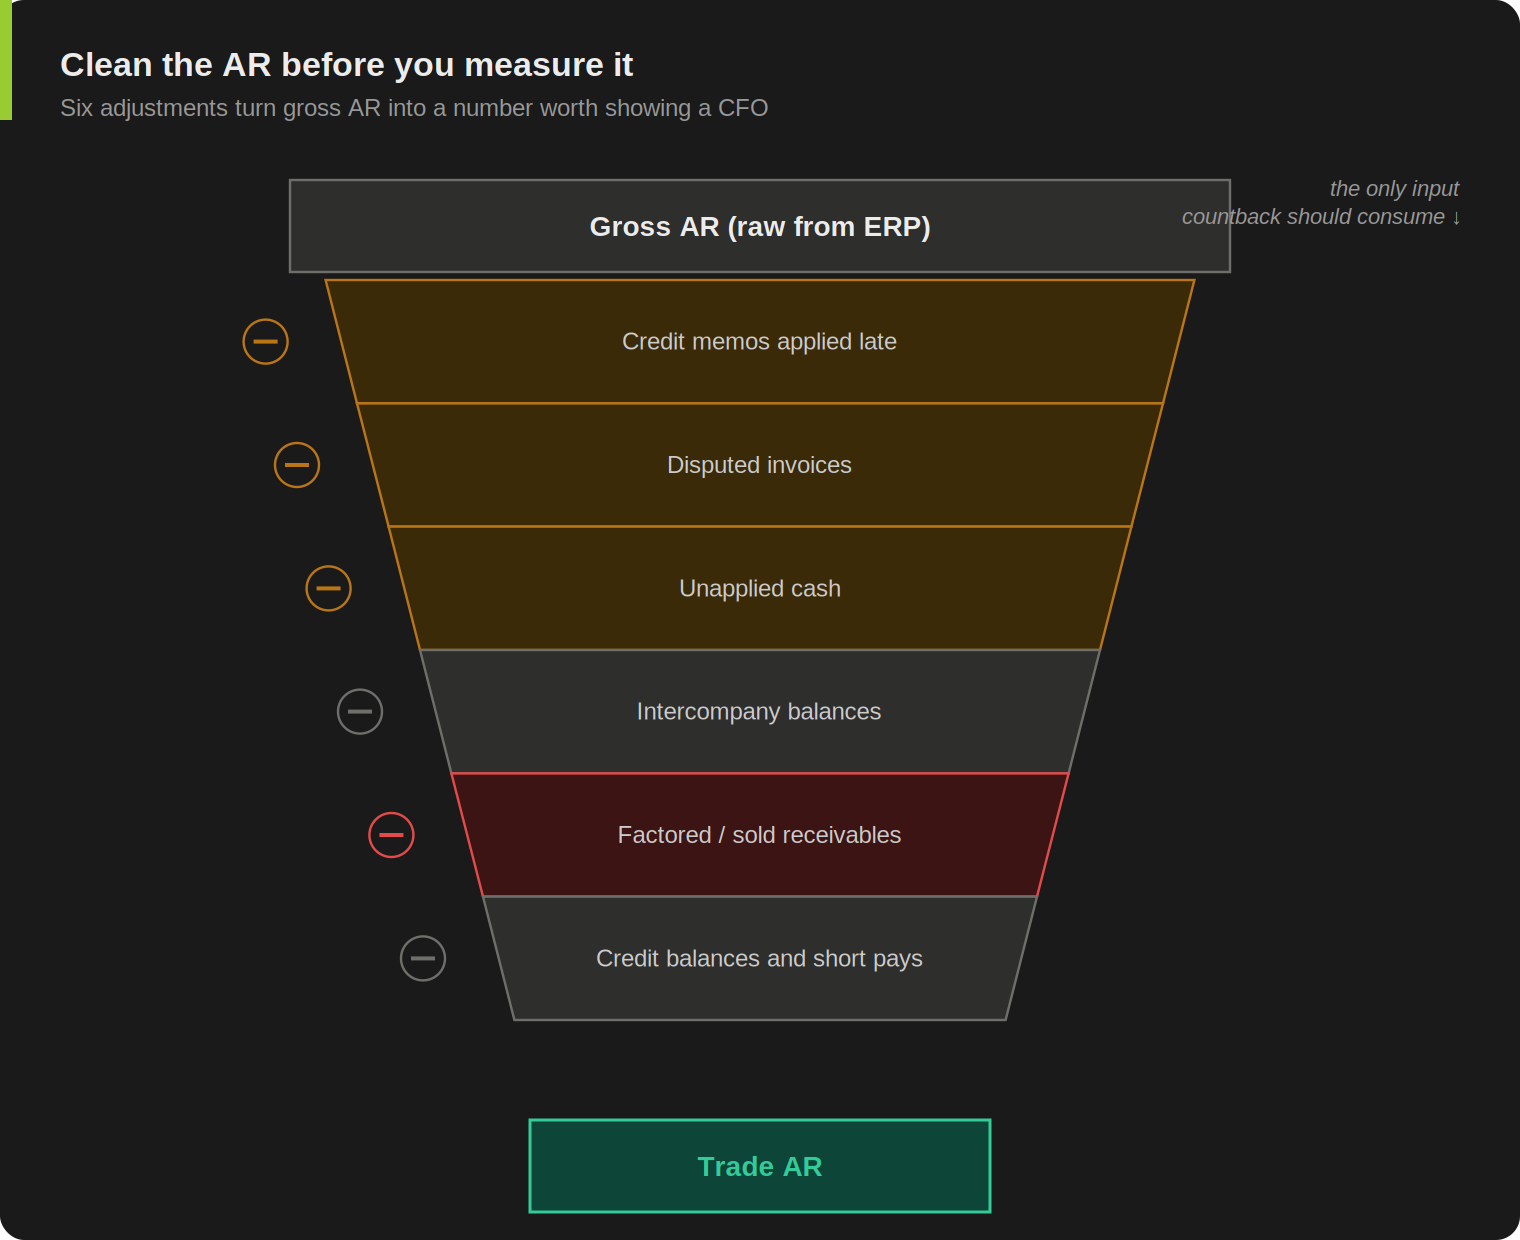
Where Countback Breaks: Six Corrections to Run First
Countback is more honest than standard DSO, but it isn't bulletproof. If you run it on raw AR, you'll get a number that's still half noise. On most manufacturer AR books I've cleaned, the unrefined countback runs 10 to 20 days higher than the trade-AR-only number. Same data, very different conversation with the CFO. Six adjustments matter before the math is worth showing to anyone.
Credit memos applied late to old invoices distort countback because they reduce AR after the invoice has already aged. The remaining receivable looks like an old, slow-paying account, but it's actually a billing artifact. Net trade AR after credit notes is the cleaner input.
Disputed invoices stuck in AR for non-payment reasons inflate countback. A $300K credit claim sitting unresolved for nine months is a commercial issue, not a collection-speed problem. If disputes are material, segregate them. Track them on their own dashboard with their own owner and their own age. Otherwise they'll dominate the countback math and tell you the wrong story.
Unapplied cash is the cheapest fix and the easiest to miss. Customer payments received but not matched to invoices reduce nothing in your AR aging. The invoice still looks open. Countback reads the AR as older than it is. Run an unapplied cash report monthly. Match before you measure.
Intercompany balances sit in AR in many ERPs but don't trace to trade credit sales. They follow a different cycle, often with internal settlement rules that have nothing to do with customer payment behavior. Exclude them before running countback. Same for non-trade receivables: advances to suppliers, employee balances, security deposits.
Factored or sold receivables change the meaning of DSO entirely. If you've sold a portion of your AR to a bank or factor, your AR balance is artificially low, your DSO reads better than your customers' actual payment behavior, and countback inherits the same problem. Either work with the gross AR before factoring, or flag the metric as post-factoring and read it accordingly. Same logic for receivables under insurance or formal financing programs.
Customer credit balances and short payments distort net AR in opposite directions. A customer running short-pays creates a stub balance that looks like a slow invoice. A customer with a net credit balance reduces the AR total without reflecting any collection activity. Segregate both categories in your aging before consuming the AR in countback.
One last note on method, not data: countback assumes roughly FIFO collection. The oldest invoices are paid first as cash comes in. In most B2B environments this is reasonable, because customers generally pay in invoice-date order. If you have a known pattern of customers skipping specific old invoices (a stuck disputed line, a deliberately ignored one), countback will read older-than-reality. Worth checking before publishing.
These corrections aren't optional. The point of the method is the integrity of the measurement. Run it on dirty data and you've built a slightly different broken gauge.
Fix the Gauge Before the Process: Measurement System Analysis
In Lean Six Sigma language, what you just read is a measurement system problem. Before improving a process, you verify that the metric used to measure it is reliable enough for the decision you're making. The traditional discipline is called measurement system analysis (MSA). It covers things like gauge precision, bias, repeatability, and reproducibility. That's the kind of work an industrial engineer does on calipers, scales, and torque wrenches in a manufacturing plant. The principle transfers cleanly to a management metric. Same discipline, different gauge: ask whether the measurement you're consuming is fit for the decision in front of you. If the gauge is broken, every improvement decision based on its readings is built on noise.
The standard DSO formula is a broken gauge for any business with revenue volatility or sustained growth. Running collection projects on a metric that swings with sales mix is like trying to lose weight by recalibrating the scale each morning. You'll see numbers move. You won't know what they mean.
This is the same principle CC-AA01 applied to month-end close cycle time. Most teams measure close in calendar days including weekends and holidays. The gauge reports a "5-day close" when the team actually worked four working days plus one weekend. The number says the close improved when the work didn't. Same fix: measure the process the way the process actually happens.
The Lean answer is the same in both cases. Fix the gauge first. Then improve.
There's a temptation, once you find the gauge is broken, to go straight to redesigning the collection function. Resist it for a quarter. Track countback DSO and the gap-to-terms number every month first. The trend is what matters, not the absolute number. After three or four data points, you'll know whether you have a stable structural issue (renegotiate terms or change collection priorities), a degrading trend (build the case for resourcing), or noise (revisit assumptions). One number isn't a diagnosis. Three months of countback movement is.
Try This Before Your Next Finance Meeting
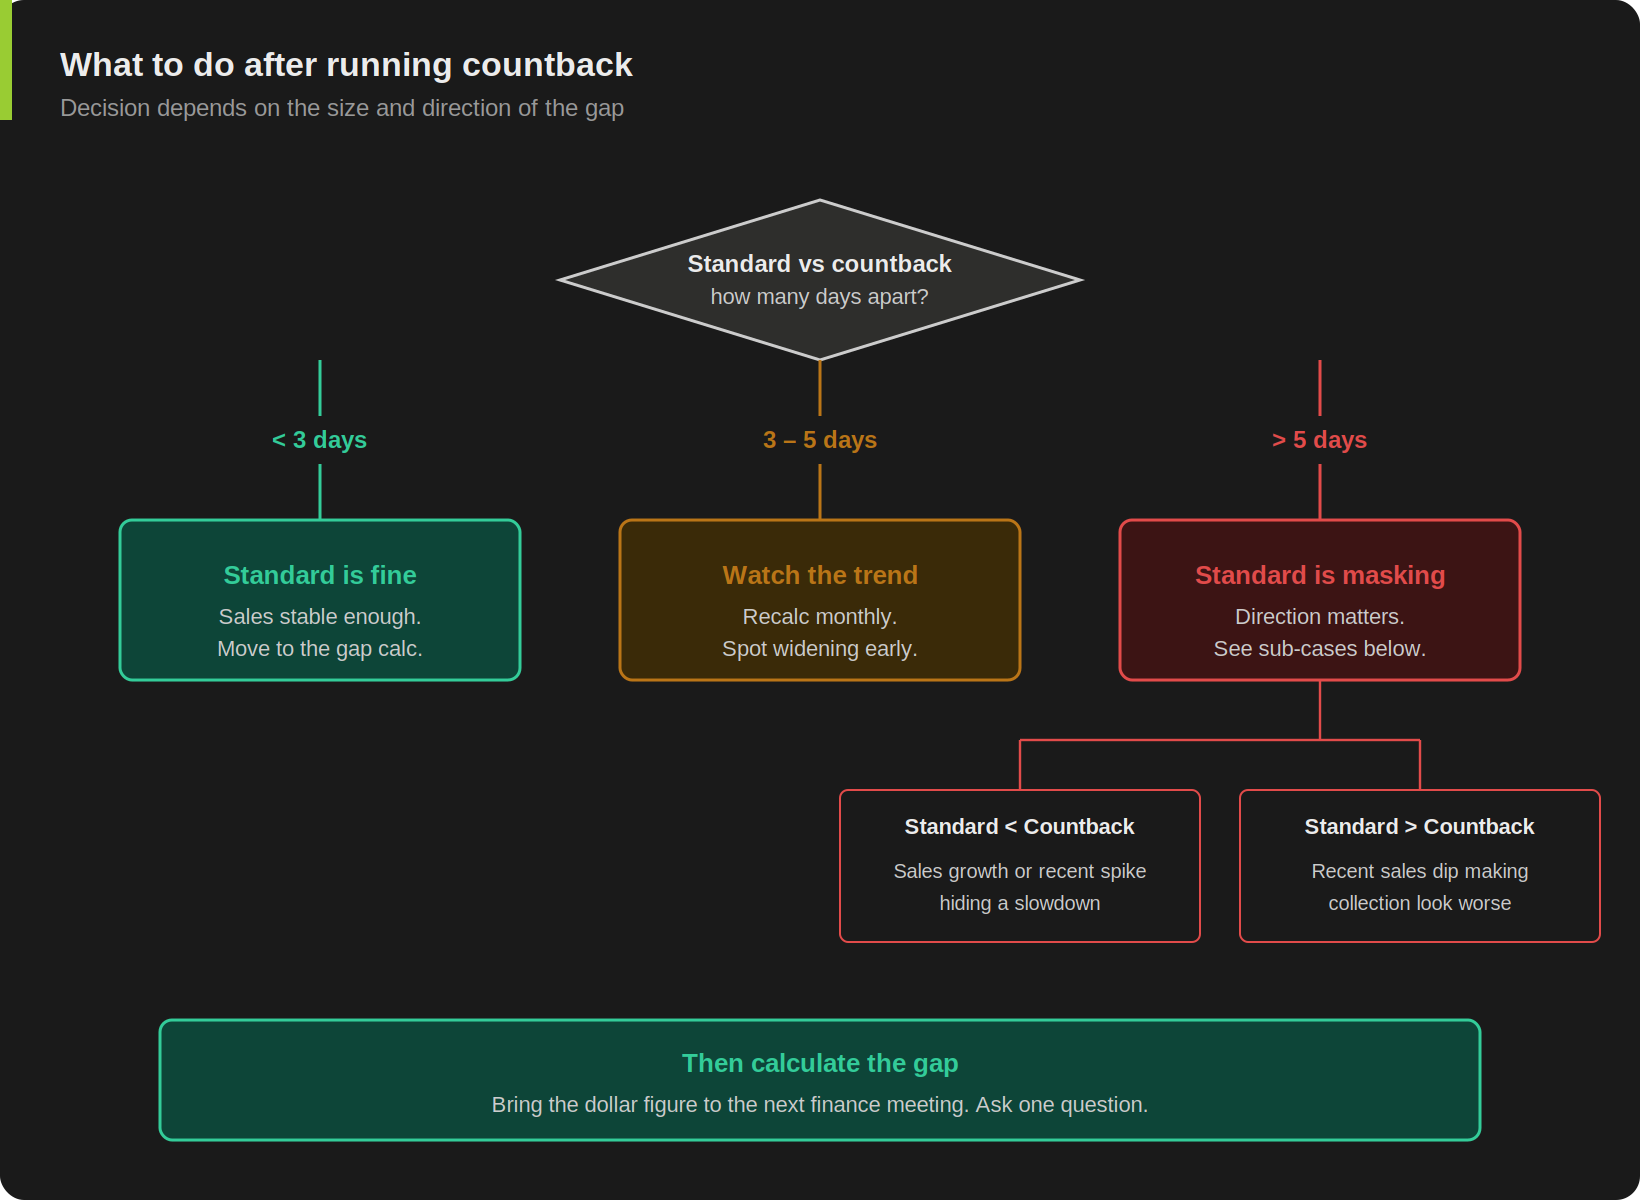
Export your end-of-month AR balance and your last three months of trade revenue. In a single column, write last month's revenue, the prior month's, and the one before that. Now subtract: AR minus last month's revenue. If positive, subtract the prior month. Stop when AR is exhausted. Count the days you've consumed. That's your countback DSO.
Compare to your standard DSO. If the two are within three days, your revenue is stable enough that standard DSO is doing its job. If they differ by more than five days, simple DSO is masking reality. The next question is which direction the masking goes. Did standard read low (likely growth or a recent revenue spike hiding a slowdown) or high (likely a recent revenue dip making collection look worse than it is)?
Then calculate the gap. Countback DSO minus your weighted average payment terms, multiplied by daily trade revenue. That's your unpriced credit.
Bring that single number to your next finance meeting. Don't propose a project. Don't recommend a collections push. Put the number on the table and ask one question: are we OK with that, or is it time to do something about it?
That's the conversation simple DSO has been preventing.
FAQ
-
My ERP only shows a "DSO" field on the AR dashboard. Is that standard or countback?
In every ERP I've worked with (SAP, Oracle, Dynamics, and Sage variants), the out-of-the-box DSO is the standard formula: AR divided by recent revenue. Some systems offer a countback option in a separate report, but it's rarely the default. Check the documentation, or pull the calculation logic from the AR module's technical guide. If your dashboard hasn't been customized, assume standard. The fix doesn't require an ERP change. Countback can run in Excel against the same AR and revenue exports you already pull every month.
-
My CFO sees DSO every month. If I switch to countback, will the number look worse or better?
It depends on revenue pattern. Stable revenue, the two agree within a day or two. Volatile or growing revenue, countback usually reads higher. That's the more accurate read showing through, not a worse business. Frame it that way before the meeting. Don't swap one metric for another silently. Run both for two or three months, show the divergence on a chart, and explain which one reads correctly under which conditions. In my experience, CFOs accept the switch quickly once they see one month where standard DSO contradicted what the collection team was actually reporting.
-
How do I get IT to add countback to the AR dashboard?
You don't need IT for the diagnostic. Countback is a few rows in Excel against an AR balance and three months of revenue. Build it as a refreshable workbook with two queries: one against the AR balance, one against the G/L revenue posting. The calculation is subtraction and a proportion. You can have a working version by end of day. The full production implementation, with Power Query refreshing both data sources automatically, a weighted-terms calculation by customer segment, and a trend view that flags break points, is a course-level build. The simple version is a controller-level afternoon.
-
Does this work for a service business, or only for product companies with shippable inventory?
It works for any business that bills against terms and accumulates receivables. Service businesses where revenue is recognized over time (professional services with milestone billing, subscription invoicing) need one extra step. Walk backward through billed revenue from your invoice register, rather than recognized revenue from the income statement. The receivable came from an invoice, so that's the right denominator. The math is identical from there.
The full countback DSO build, with refreshable Power Query data sources, weighted average terms by customer segment, and a collection efficiency view that flags trend breaks automatically, is part of CC-AA02: Net Working Capital Optimization on GoFast.Finance. Stop rebuilding NWC analysis every month.
The series so far: Article 1: Your Cash Is Trapped opened the cash conversion cycle and the three levers that move NWC. This article fixed the first gauge: receivables. Next: which customers are causing the problem, and why treating every overdue account the same wastes most of your collection effort.
This article originally appeared in the Practical Lean Finance newsletter on LinkedIn.
Sources
Standard DSO formula. Corporate Finance Institute, Days Sales Outstanding (DSO). CFI defines DSO as accounts receivable divided by net credit sales, multiplied by the days in the period. Average AR is often used in longer periods to reduce timing distortion.
Countback DSO method. Public AR practice references describe countback as walking backward through monthly credit sales until the AR balance is exhausted, producing a sales-equivalent age of receivables that handles seasonality and large recent orders better than the simple formula.
Measurement System Analysis (MSA). American Society for Quality (ASQ), Lean Six Sigma Body of Knowledge. MSA sits in the Measure phase and asks whether the current measurement system is adequate for the improvement decision in front of the team. The traditional application is gauge studies on physical instruments. The same discipline transfers to management metrics: verify the gauge before improving the process.
AIAG MSA Reference Manual. Automotive Industry Action Group. Reference manual for measurement system analysis in industrial quality engineering, the foundation for the principle applied here to a finance metric.