- May 17
Your Cash Is Trapped. Here's Where.
- Arnaud Lemaire
- Accounting & Auditing
- 0 comments
A controller at a manufacturing site I worked with had a clean close. Five business days, good team, tight process. Then the CFO pulled her aside: "Our working capital is $14M. That's too high. Fix it."
She came to me. I asked her three questions. What's your DSO? What's your DPO? When was the last time anyone reviewed inventory aging? She couldn't answer any of them. Fourteen million dollars on the balance sheet and nobody could point to where the cash was actually stuck.
Not because she was bad at her job. Because the number she reported to the board was one number. And one number hides everything.
This is the first article in a new Practical Lean Finance series on net working capital optimization. If you followed the first series on month-end close, this picks up where that left off: once you've got clean numbers on time, what do those numbers tell you about where your cash is stuck? If you're new here, no prerequisite. Start here.
One Number, Three Problems
Net working capital is current assets minus current liabilities. Most finance teams report it as a single dollar figure in the board pack and move on.
That's like reporting "the close takes 7 days" without knowing which tasks sit on the critical path. You measured the outcome. You have no idea what drives it.
For reporting purposes, the full balance sheet definition is fine. For improvement, it's too broad. The operational version of NWC you can actually act on comes down to three components: receivables, inventory, and payables. Other current items matter for accounting completeness. These three are the operating levers.
The way to pull them apart is the Cash Conversion Cycle.
Your customers owe you money. DSO (Days Sales Outstanding) measures how long they get to keep it before you see cash. When DSO is high, your cash is stuck in receivables. The question is whether your customers are paying late, whether you're measuring wrong, or whether Sales agreed to payment terms that nobody in Finance knows about.
You have inventory on shelves. DIO (Days Inventory Outstanding) measures how many days it sits there before someone sells it or uses it in production. When DIO is high, your cash is sitting in a warehouse. The question is whether those materials are actually moving, or whether some of them carry a "safety stock" label that's hiding slow-moving inventory nobody has reviewed.
You owe your suppliers money. DPO (Days Payable Outstanding) measures how many days you hold that cash before you pay. When DPO is low, you're releasing cash faster than you need to. I've never audited an AP department that knew its average days-early figure. They track invoice processing time. They track payment error rates. In many cases, nobody has quantified whether invoices are going out the door before the due date, or how much cash that timing pulls out of the business.
CCC = DSO + DIO − DPO. That's how many days your cash is trapped in the operating cycle.
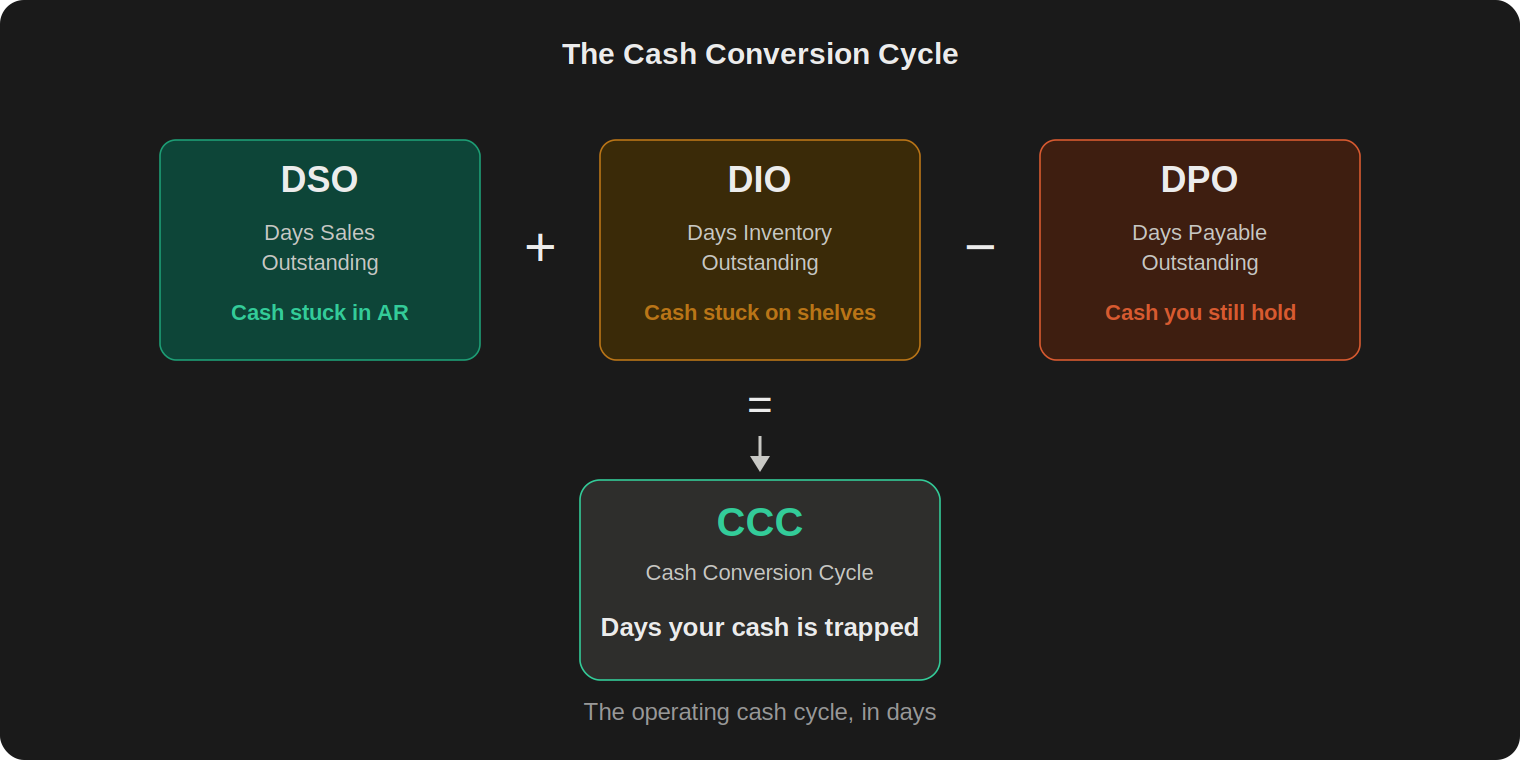
The Cash Conversion Cycle: three components, three functions, one number that tells you how many days your cash stays trapped in operations.
A quick note on the formula. DPO reduces the cycle because payables represent cash you haven't released yet. The longer you hold supplier cash (within your agreed terms), the shorter your overall cash cycle. That's why improving NWC is never just "collect faster." It's a balance across all three components.
One more clarification on DIO before we move on, because the two get confused: DIO is a financial ratio that tells you how many days of inventory you carry at the balance sheet level. Inventory aging is an operational analysis that tells you which specific materials, batches, or SKUs have not moved. DIO tells you there is a problem. Aging tells you where it sits. You need both. The course goes deeper on this in the inventory module, but the distinction matters even at the diagnostic stage.
What does a "good" CCC look like? It depends entirely on your industry. A retailer, a software business, a distributor, and a capital-intensive manufacturer can all have very different healthy CCC levels, driven by their operating model. The Hackett Group found the average CCC for the top 1,000 U.S. public nonfinancial companies sat at 37 days in 2025, after deterioration in 2023. But a single benchmark is less useful than your own trend and your peer comparison. A CCC that moved from 40 to 52 in two quarters is a signal, regardless of where your industry average sits.
The direction matters more than the level. And the decomposition matters more than the total, because a CCC increase from 40 to 52 could mean DSO worsened by 12 days (a collection or terms problem), or DIO worsened by 15 days while DPO improved by 3 (a production planning problem partially masked by slower payment). Same total movement. Completely different root cause. Completely different fix.
The Controller's Numbers
Back to my controller. We pulled her numbers.
DSO: 52 days on Net 30 terms. Her customers were keeping her cash for three extra weeks and nobody had asked why.
DPO: 12 days on average Net 45 terms. Her AP team was paying invoices a month before they were due. Not because anyone told them to. The payment run was configured to pick up every approved invoice, and nobody had set a "hold until due date" rule. So invoices cleared the approval workflow and went straight out.
DIO: 78 days. The last time anyone had reviewed which materials were actually moving was before the previous controller left.
CCC: 52 + 78 − 12 = 118 days. Her cash was trapped in the operating cycle for nearly four months.
Let's put rough dollars on each problem. Her daily revenue was about $38K. The DSO gap alone (22 extra days beyond Net 30) meant roughly $830K sitting in customer accounts that could have been collected. Her daily COGS was about $28K. The DPO gap (33 days of early payment on Net 45 terms) meant about $920K released to suppliers before it needed to be. And 78 days of inventory at $28K daily COGS was $2.2M on shelves. Some of that inventory was legitimate. Some of it hadn't moved in a year.
Those are just the gap portions. The DSO and DPO numbers represent cash that's clearly addressable: invoices paid before due date, receivables collected beyond terms. The inventory figure is total days on hand, and some of it is legitimate operating stock. But even the AR and AP gaps alone total $1.75M in cash that could have been in the bank account. And 78 days of inventory without a recent review almost certainly includes dead stock on top of that.
Same $14M. Three completely different problems. Three conversations she'd never had.
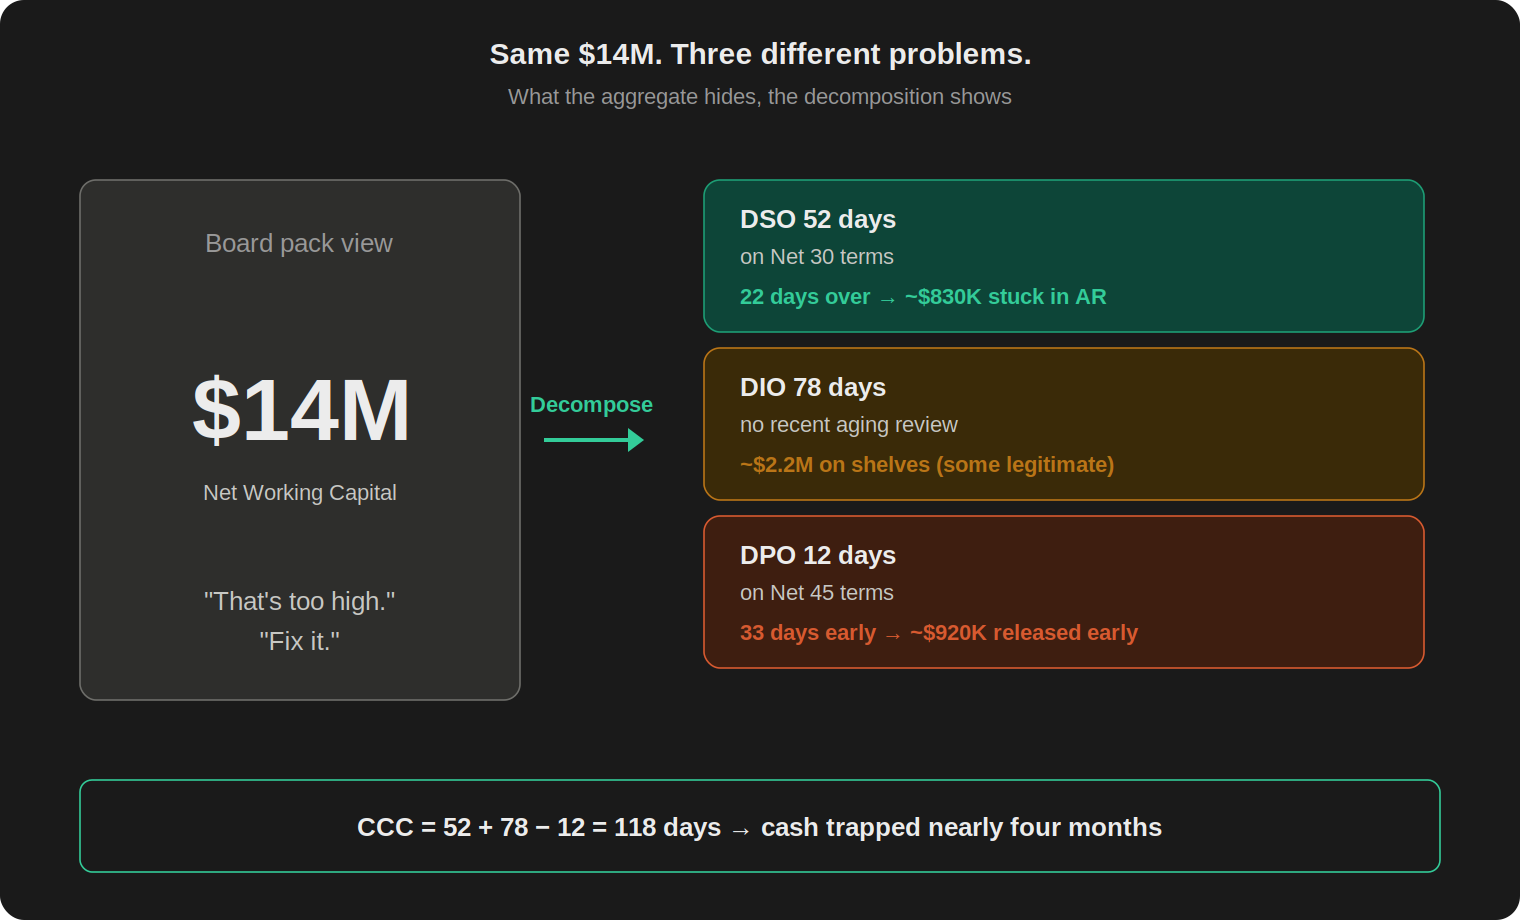
Same $14M, three problems. The aggregate told the CFO nothing. The decomposition told the controller exactly where to look.
In Lean Six Sigma terms, this is the diagnostic step: define the current state before improving anything. In the first series, we measured close cycle time before touching a single task. The same principle applies here. You decompose the CCC before touching a single invoice.
These patterns come from over a dozen close and NWC diagnostics I've run across manufacturing and industrial companies. The numbers change. The structure repeats. If you want to see how the full NWC analytical framework connects, that's what we built in the CC-AA02 course on GoFast.Finance.
A Different Kind of Trapped
A group controller at a mid-sized industrial company I worked with had respectable headline numbers. DSO: 38 days on Net 30. DPO: 40 days on Net 45. Inventory looked stable quarter over quarter. The CFO was satisfied. Nobody was asking questions.
The problem was invisible in the aggregate. DSO at 38 days looked fine because revenue had spiked 20% in the last month of the quarter. The simple DSO formula (AR / daily revenue) uses current-period revenue as the denominator. When revenue spikes, DSO drops mechanically, even if customers haven't changed their payment behavior at all. Strip out the revenue spike and recalculate, and the real collection speed was closer to 48 days. Ten days of hidden cash.
DPO at 40 looked healthy on the surface. But when we broke it down by supplier segment, the top 5 suppliers (70% of spend) had negotiated Net 60 terms and were being paid around Day 50. The remaining 150 suppliers had standard Net 30 terms and were being paid around Day 18. The aggregate DPO of 40 averaged the two groups and looked fine. Underneath, the AP team was financing 150 small suppliers for free, paying them 12 days before due, while the large suppliers (the ones with leverage to negotiate longer terms anyway) got paid roughly on time. Nobody had segmented suppliers by spend, terms, or strategic importance. The system paid whatever was approved, in the order it cleared.
Inventory was stable at $6M. Stable, until you opened it up. Raw materials had dropped $400K. Finished goods had increased $500K. The net movement looked like a $100K increase. The underlying story was that production was running ahead of sales, piling up finished goods that hadn't shipped. The production planner was building to forecast. The forecast was three months old.
This controller wasn't failing. The numbers weren't alarming. And that's exactly why nobody looked. The aggregate masked a collection illusion, a payment segmentation gap, and a production-sales misalignment. Three issues, all invisible in the board pack.
The first controller had obvious problems: every ratio was off. This one had hidden problems: every ratio looked acceptable, but the composition underneath told a different story. In my experience, the second pattern is more common and more dangerous. Obvious problems get attention. Hidden problems compound. By the time someone finally decomposes the number, the gap between what the board pack says and what the cash position actually represents has been growing for quarters.
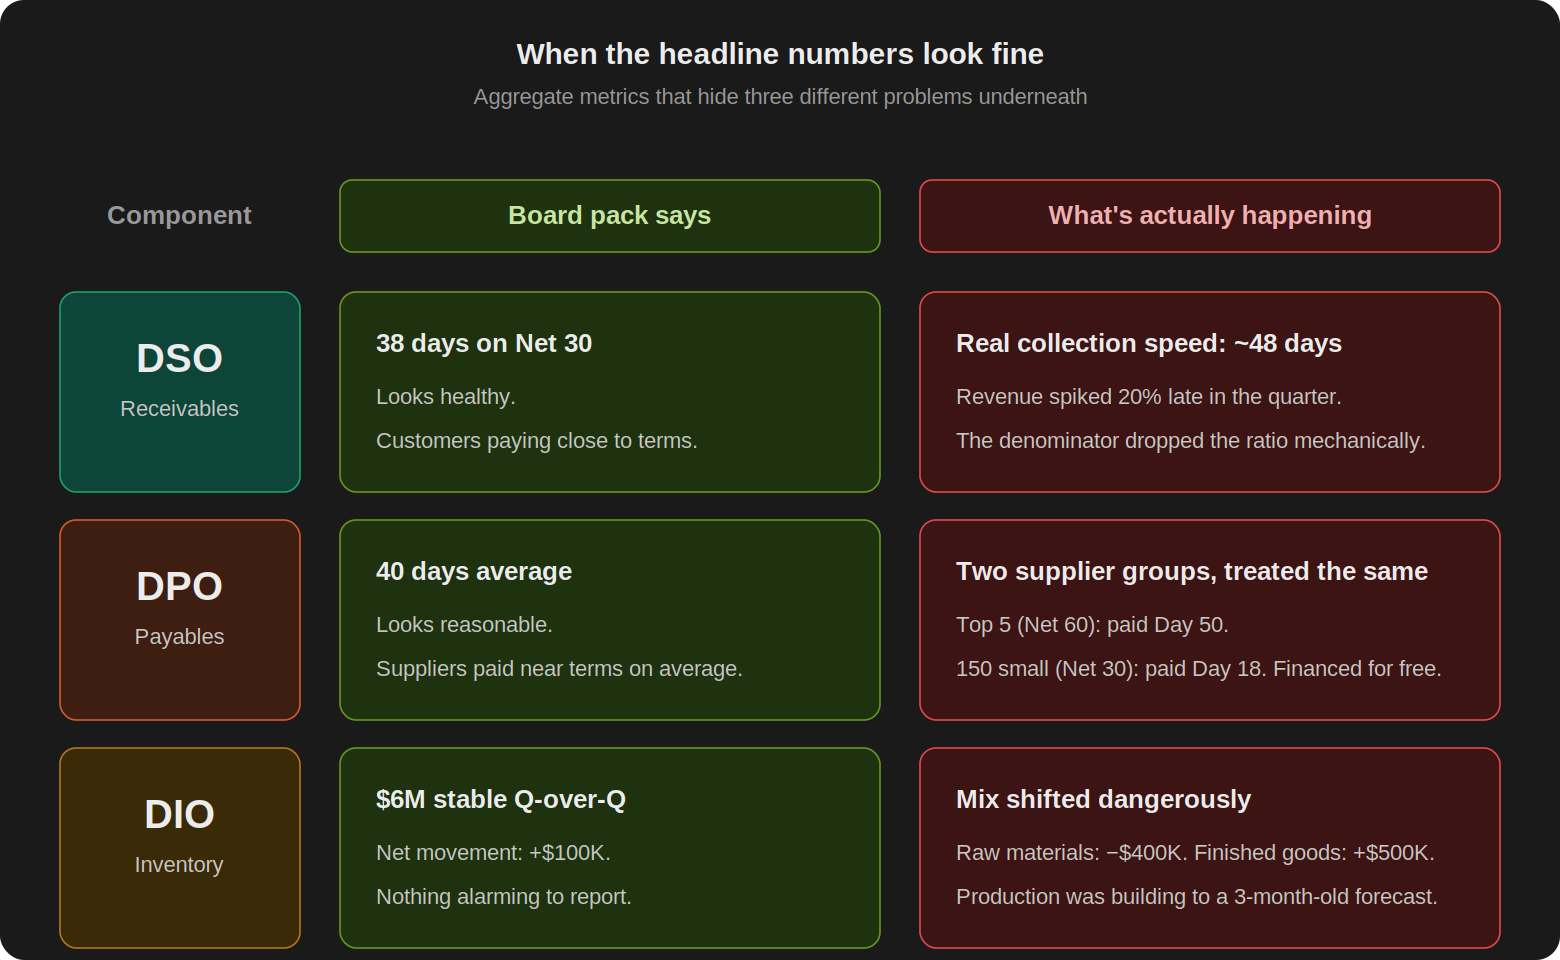
When aggregate numbers look fine, the decomposition still matters. These three issues were invisible in the headline NWC figure.
Three Levers, Three Owners
Here's where most NWC discussions fail. The CFO says "reduce working capital" and finance treats it as one project. Each component is its own project. Each has a different owner, and the person who controls the lever usually doesn't sit in Finance.
DSO is a conversation with Sales and Credit. Not a dunning campaign. If your biggest customer has been paying at 60 instead of 30 for two years and nobody in Sales has been asked about it, that's not a collection failure. That's a commercial relationship nobody challenged. The credit team sets the terms. Sales sometimes overrides them. AR inherits whatever was agreed. If Finance is only involved at the dunning stage, the cash was already trapped weeks earlier.
DPO is a conversation with AP and Procurement. The person who negotiated the payment terms and the person who runs the payment often don't talk to each other. The buyer agreed to Net 45. The AP team pays on Day 12 because the invoice is approved and the payment run picks up everything that's ready. Nobody configured the system to hold until the due date. Nobody asked. And Treasury, if the company has a treasury function, often only gets involved for large one-offs or bank relationships, not for daily AP timing. The gap between "terms negotiated" and "payment executed" can cost hundreds of thousands in unnecessary early cash outflow, and it's nobody's explicit job to close it.
DIO is a conversation with Operations and Supply Chain. The controller owns the balance sheet number. Operations owns the explanation. Without the breakdown by material category, you can't even ask the right question. "Inventory is stable" might mean raw materials dropped 5 days while finished goods increased 12 days. The aggregate masked the problem. Safety stock parameters set three years ago might still be driving replenishment for products whose demand pattern has completely changed. The production planner doesn't check with Finance before ordering. Finance doesn't check with Operations before reporting. They both look at the same line item and see different things.
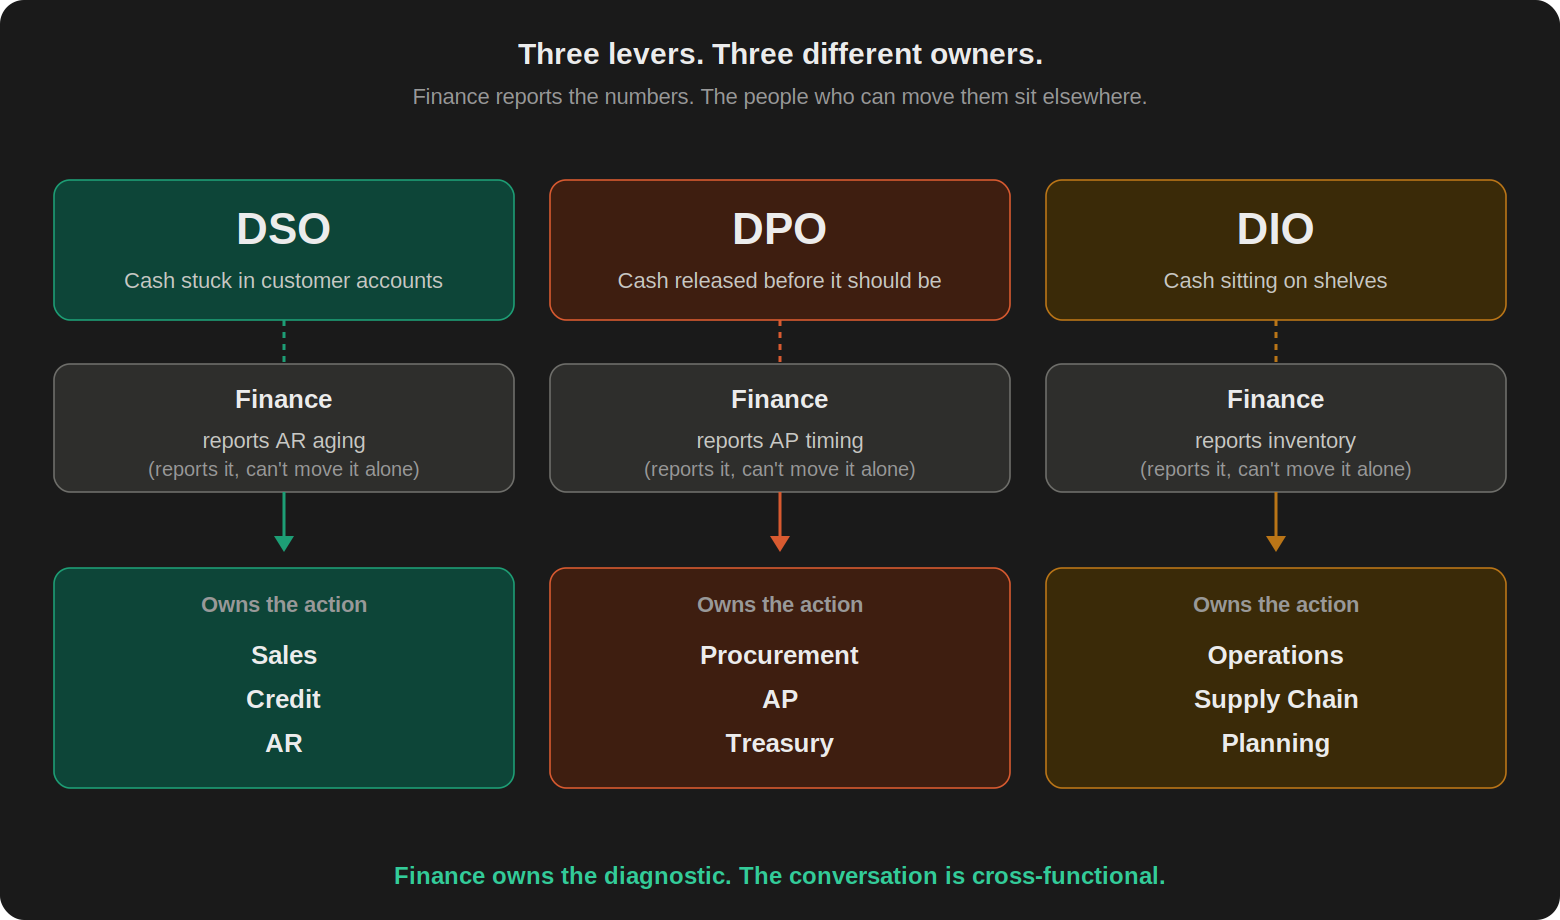
Three NWC levers, three functional owners. The person who controls the lever rarely sits in Finance. NWC improvement requires cross-functional conversations, not a finance-only project.
If you followed the first series, this should feel familiar. In close optimization, the bottleneck was almost never the task itself. It was the handoff between functions, the upstream dependency that nobody owned. Same principle here. The bottleneck in NWC is the specific component that's stuck and the specific function that controls it. The aggregate hides both.
This is also why "working capital improvement" as a finance-only initiative almost always fails. Finance can pull the numbers, build the dashboard, calculate the gap. What Finance cannot do alone is change customer payment behavior, reconfigure AP payment runs, or challenge safety stock assumptions that Operations has had in place for years. The diagnostic sits in Finance. The action sits outside Finance. Bridging that gap is the actual work.
Why Finance, then? Because Finance is the only function that sees all three components at the same time. Sales knows AR aging. Procurement knows payment terms. Operations knows what's on the shelves. Nobody else calculates the CCC. Nobody else can walk into a meeting and say: "Our cash cycle worsened by 8 days this quarter. Here's which lever drove it. Here's who we need in the room."
That's the orchestration role. Finance doesn't fix the levers. Finance identifies which one moved, quantifies the impact, and starts the right conversation. The risk of not doing this is local optimization: Sales extends terms to close a deal without knowing the cash impact, AP pays early to clear their queue without knowing the financing cost, Operations builds to an outdated forecast without knowing the carrying cost. Each decision makes sense in isolation. In aggregate, they add weeks to the cash cycle.
Every article in this series includes the cross-functional conversation: who to talk to, what to bring, and what to ask. Because the analytical insight without the conversation is just a report that sits in a folder.
One more thing before we go to numbers. The goal here is not to minimize every component blindly. Aggressive collection behavior can destroy strategic customer relationships. Cutting inventory too far creates stockouts on critical materials and shuts down production lines. Stretching DPO past your suppliers' tolerance damages reliability and costs you discounts that would have beaten your cost of capital. The right answer is the right cash cycle for the business model, with each lever calibrated to its trade-off, not the lowest CCC number on a benchmarking chart.
The Scale of the Problem
This isn't a small-company issue.
The useful part of benchmarking is not the exact number. It's that every dataset shows the same pattern: working capital improvement requires all three levers. Three studies, three different populations, same direction.
Hackett Group (2025 U.S. Working Capital Survey) surveyed the top 1,000 U.S. public nonfinancial companies. They found $1.7 trillion in excess working capital. Not total. Excess: cash that could be released if these companies performed at top-quartile levels. That's 35% of gross working capital and 11% of aggregate revenue. Receivables alone accounted for $600 billion of that gap. The DSO difference between top and median performers was 18 days. Eighteen days of revenue sitting in customer accounts that the best companies figured out how to collect.
J.P. Morgan (2024 Working Capital Index) looked at S&P 1500 companies and found CCC increased by about 2.4 days in 2023 versus the prior year. They estimated $707 billion in total opportunity to release liquidity if companies moved to top-quartile performance. The largest single component was inventory at $353 billion, followed by receivables at $223 billion and payables at $130 billion. Different population, different year, different lead component than Hackett. Same story.
Visa (Growth Corporates Working Capital Index) studied mid-market companies. Their 2024-2025 report found 84% had faced cash flow gaps in the prior year, and 37% of invoices were paid early. Early payment is not automatically bad. It can be valuable when it captures supplier discounts, improves pricing, or supports a strategic supplier relationship. It becomes a problem when invoices are paid early by default, without anyone checking the discount math, segmenting suppliers, or quantifying the cash impact. Visa's updated 2025-2026 index shifts the framing further, positioning working capital as a growth enabler rather than only a liquidity buffer. Based on 1,457 CFOs and Treasurers across 23 countries, five regions, and 10 industry groups.
Every study points to a different component as the biggest opportunity. That's not contradiction. That's different populations measured in different years. The conclusion is the same: cash is stuck across all three levers, and fixing one without looking at the other two leaves money on the table.
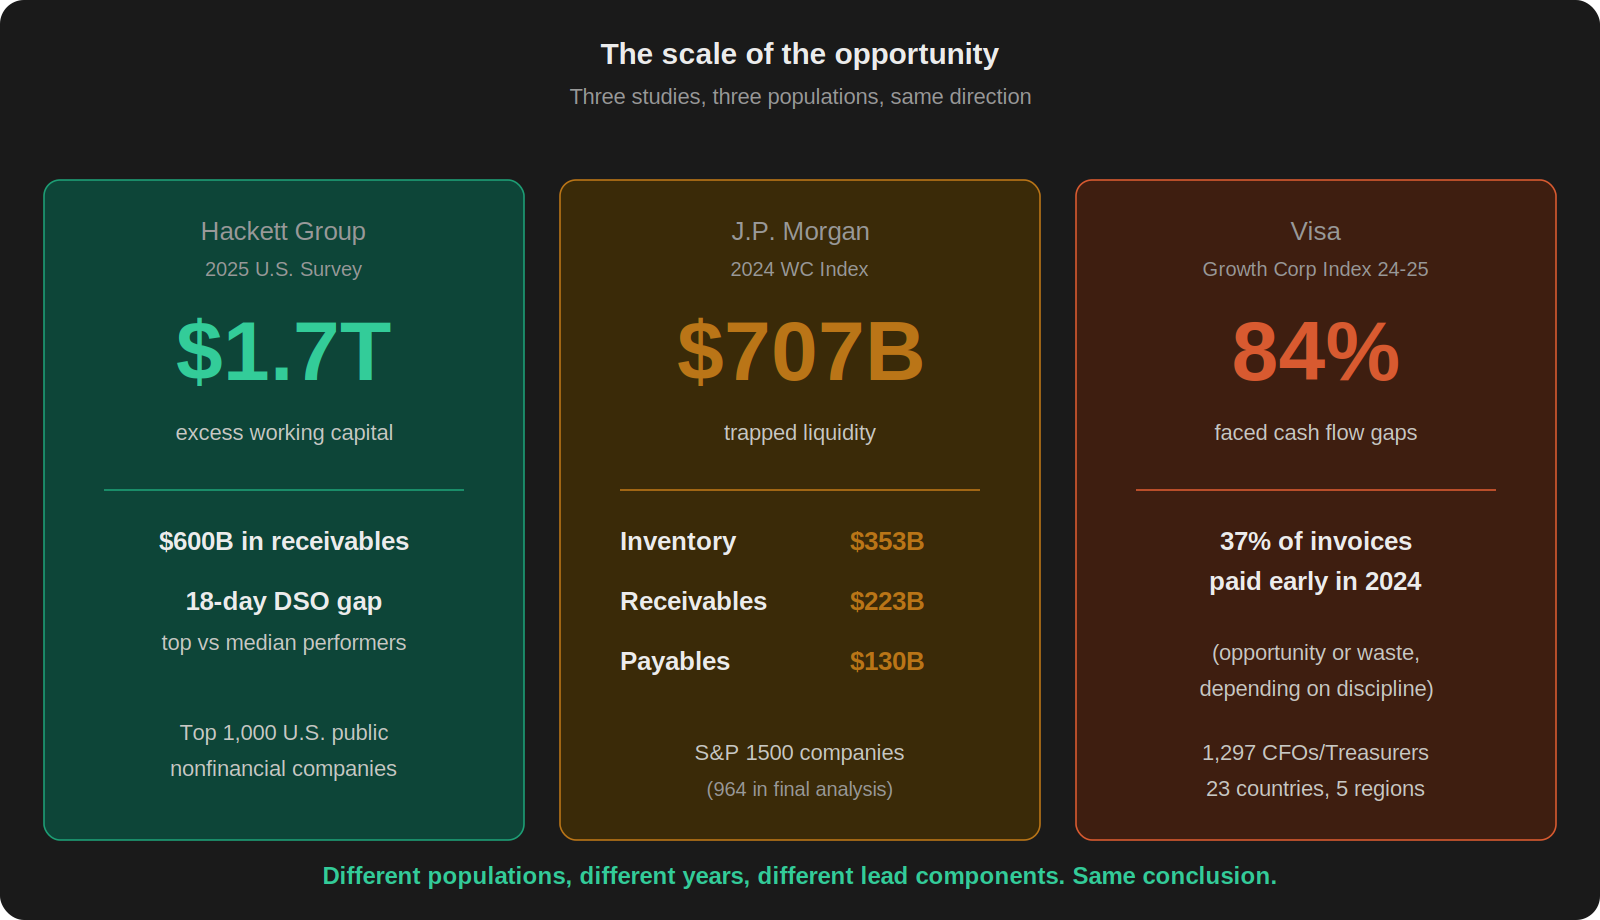
Three studies, three populations, same conclusion. The opportunity is real, and it sits across all three components.
One number worth sitting with: $1.7 trillion in excess working capital across the largest U.S. companies. These are not small businesses with broken processes. Hackett estimates that 35% of the gross working capital across this sample is excess relative to top-quartile performance. The problem is structural across the population, not a one-company execution issue. Which is good news, in a way: if the largest, most sophisticated finance organizations still leave that much cash on the table, the playbook to recover it is reproducible.
Common Pushback
"We already track DSO and DIO in our board pack." Tracking and acting are different things. Most board packs show the ratio. Very few show the movement compared to last quarter, the specific customers or material categories that drove the change, or the name of the person who owns the next conversation. A ratio without an owner is a reporting exercise.
"Working capital is Treasury's problem." Treasury manages liquidity. Working capital is operational cash trapped in customer invoices, supplier payments, and warehouse shelves. Treasury can optimize around the edges (credit facilities, cash pooling, intercompany netting). They can't fix a 52-day DSO on Net 30 terms. That requires Sales, Credit, and AR working together. Calling it "Treasury's problem" is a way of not assigning cross-functional ownership.
"Our ERP already has working capital reports." Most ERP standard reports show the balance sheet view: current assets, current liabilities, the ratio. They do not decompose by lever, by customer, by material category, or by payment timing. And they almost never show the movement (this month vs. last month, this quarter vs. last quarter) in a way that makes the driver visible. The report exists. The diagnostic doesn't.
"We tried a working capital project two years ago. It didn't stick." I've seen this one many times. The usual pattern: someone ran a one-time initiative, squeezed DPO by delaying a batch of payments, claimed victory, and moved on. Six months later, everything reverted because nobody changed the system configuration, the payment run logic, or the upstream process that was generating the problem. NWC improvement only sticks if it becomes a monthly conversation with functional owners. A one-time project is a correction. A monthly cycle is a countermeasure.
"Our business is seasonal. The CCC swings too much to be useful." Seasonality makes decomposition more important, not less. If your CCC swings 20 days between Q2 and Q4, you need to know whether that swing is driven by receivables (seasonal customers paying differently), inventory (pre-build for peak season), or payables (year-end payment acceleration). A seasonal business without component-level tracking has no idea whether this quarter's CCC is normal for the season or 8 days worse than the same period last year. Compare quarter-to-same-quarter-prior-year, not quarter-to-prior-quarter. And track the swing by component, not just the total.
What This Series Will Cover
Over the next six articles, we open each lever. Two per component. Each one applies a Lean Six Sigma tool to a specific NWC problem, with a worked example and a cross-functional conversation you can start this month.
Receivables (Articles 2 and 3): why your DSO formula lies when revenue fluctuates, and why you're chasing 200 overdue customers when 60% of the cash sits with 8 of them. Article 2 uses measurement system analysis to expose the DSO distortion. Article 3 uses Pareto analysis with a behavioral overlay to prioritize collection effort where the cash actually is.
Payables (Articles 4 and 5): the annual cost of paying invoices before they're due (almost no AP team has ever calculated it), and why "never pay early" is wrong when the discount math works. Article 4 applies waste identification to early payment behavior. Article 5 uses cost of quality to evaluate early payment discount economics.
Inventory (Articles 6 and 7): the dollar figure on dead stock that everyone knows about but nobody has priced, and a data integrity problem that can make your entire NWC number fiction before you even start optimizing. Article 6 puts a carrying cost on dead stock. Article 7 uses error-proofing to fix the GR/IR clearing backlog that distorts your inventory balance.
The series wraps with Article 8: how to connect all three into a monthly review. Three questions. Three actions. Every month. That's where the improvement cycle starts.
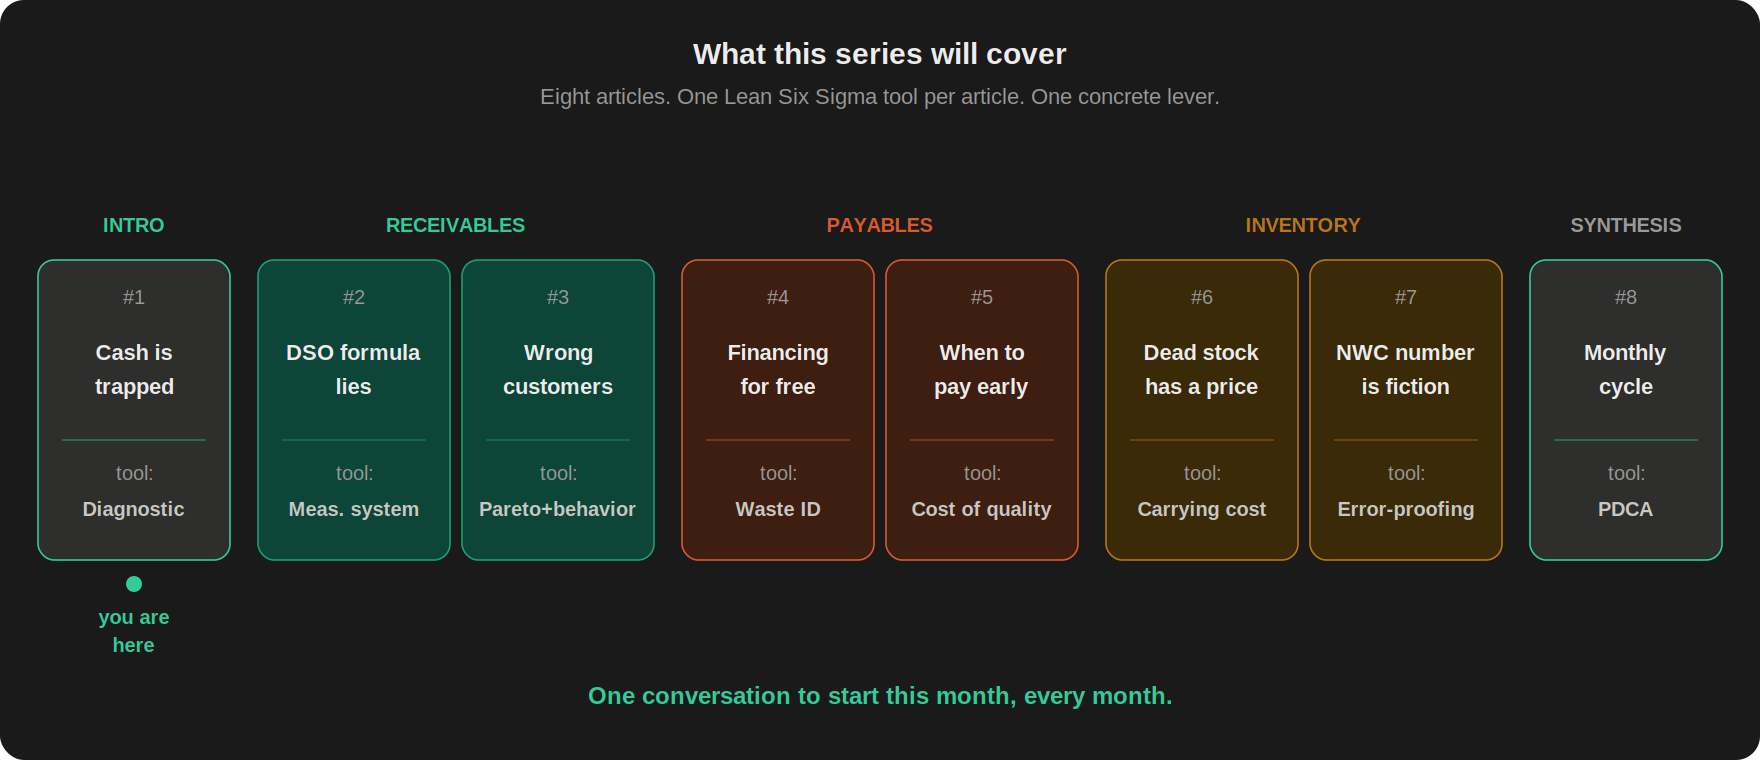
Eight articles: one intro (this article), two receivables, two payables, two inventory, one synthesis. Each article teaches one Lean tool applied to one NWC process.
FAQ
How is this different from the close optimization series? The first series optimized when you get the numbers (cycle time, critical path, upstream handoffs). This series focuses on what those numbers tell you about where cash is stuck. They're complementary. A faster close means you see the NWC picture sooner. A decomposed NWC picture means you know what to do with those numbers once you have them.
What if my company doesn't have a manufacturing inventory component? The three-lever framework still applies. Service companies and software businesses typically have minimal DIO, which means the cash cycle runs on DSO and DPO. In practice, this makes receivables and payables even more important because you don't have a third lever to offset weakness in the other two. The inventory articles (Articles 6 and 7) are manufacturing-focused, but the receivables and payables pieces apply to any business that invoices customers and pays suppliers.
What if my CFO already has a working capital target but nobody has decomposed it? That's the most common situation. The target exists at the aggregate level. The action plan doesn't exist at the component level. Start with the Controller Move at the bottom of this article. Pull the three numbers. Show them side by side against the prior quarter. The decomposition itself is the first conversation. You'll know within 30 minutes which lever moved and who should be in the room.
Do I need special tools to do this? No. The CCC calculation runs in any spreadsheet. Pull trade receivables, inventory, and trade payables from your balance sheet. Pull revenue and COGS from your income statement. The formulas are in the Controller Move below. Later articles will show more targeted analyses (countback DSO, Pareto aging, carrying cost), and the CC-AA02 course builds the full refreshable model in Power Query and DAX. But the baseline diagnostic is spreadsheet math.
How do I get my CFO to take this seriously if they're already satisfied with the current NWC level? Show the decomposition, not the total. If your CFO is comfortable with the aggregate, the total won't get their attention. What will get their attention is a specific finding: "Our customers are paying 22 days beyond terms, and that represents roughly $800K in receivables we could collect" or "We're paying suppliers 33 days before the due date, which means we're financing them for free." The total is abstract. A specific component finding with a dollar figure attached is the kind of thing that gets a meeting scheduled. One component finding, backed by a quick calculation, is usually enough to open the door. And once the door is open, the series provides the framework for the full diagnostic.
What to Do This Month
Ask this next month: Are we discussing working capital as one number, or do we know which component moved this month and who owns it?
Controller Move: Pull your latest balance sheet and income statement. Run the operating CCC baseline:
DSO = Trade AR / (Revenue / days in period)
DIO = Inventory / (COGS / days in period)
DPO = Trade AP / (COGS / days in period)
CCC = DSO + DIO − DPO
For a first pass, ending balances are fine. For a serious diagnostic, use average balances for AR, inventory, and AP. Use net credit sales for DSO if you can separate them from cash sales. Use purchases or supplier spend for DPO if you can pull the figure. COGS is a practical proxy, but in manufacturing it can distort DPO when inventory levels are moving heavily. The point of the first baseline is not perfect precision. The point is to make the movement visible.
It won't be perfect. That's fine. The goal is to compare the same calculation to last quarter and ask: which component moved, and who owns the next conversation?
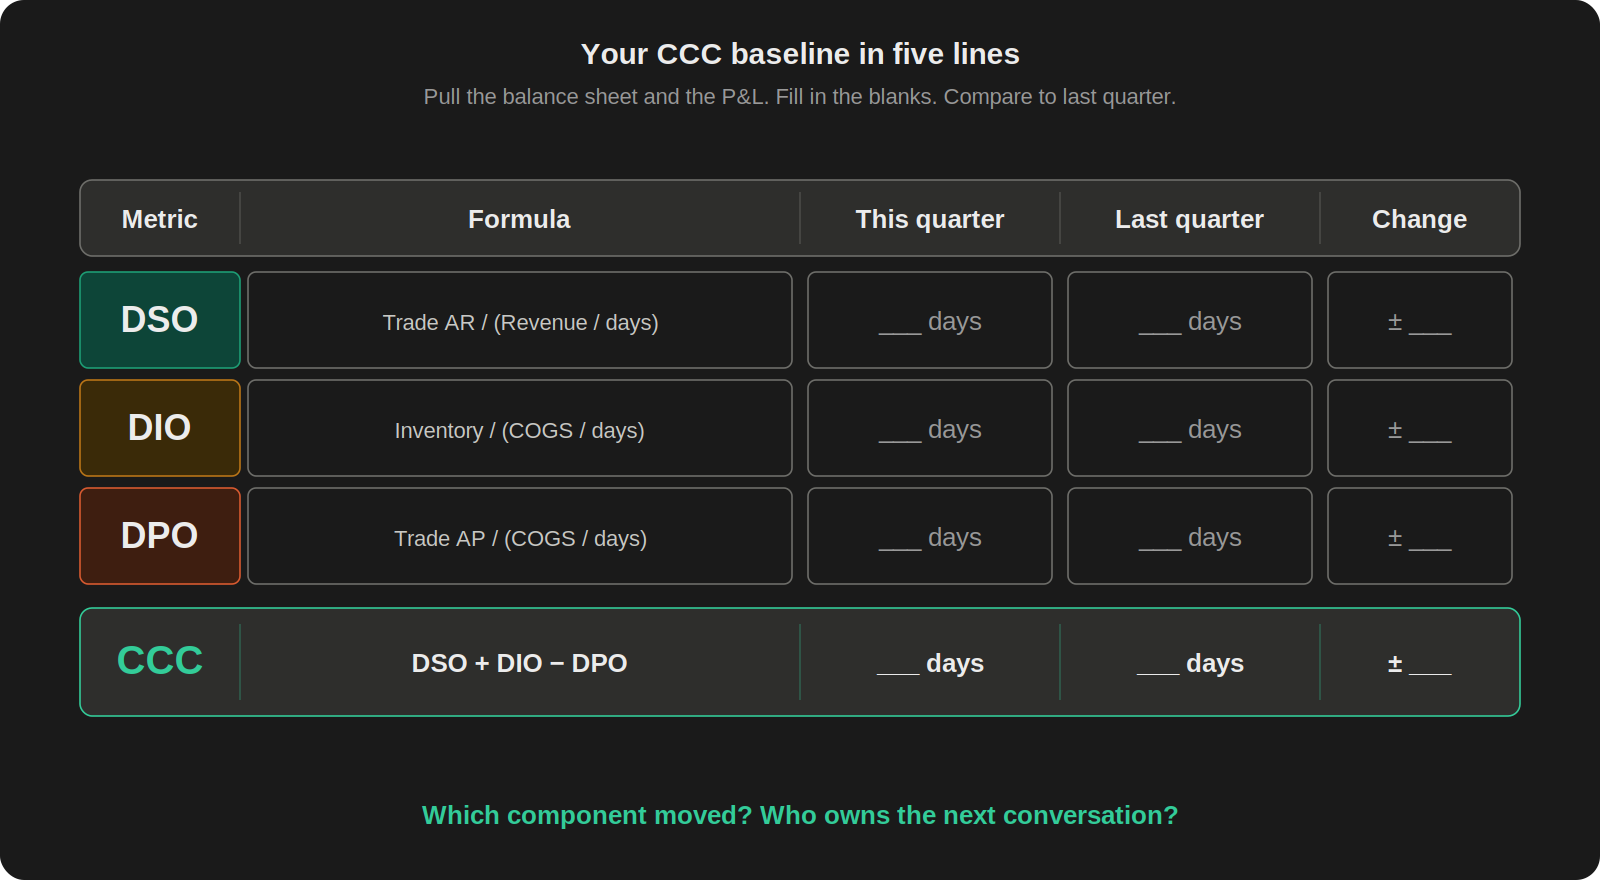
The CCC quick baseline. Four lines, two periods, one comparison. The starting point for every NWC conversation.
Next week: the metric almost every finance team reports to their CFO, and why the formula lies.
Sources
Hackett Group, 2025 U.S. Working Capital Survey. Top 1,000 U.S. publicly traded nonfinancial companies. $1.7 trillion in excess working capital (35% of gross working capital, 11% of aggregate revenue). CCC improved to 37 days after 2023 deterioration. 18-day DSO gap between top and median performers. Receivables represented the largest excess working capital opportunity at $600 billion.
J.P. Morgan, 2024 Working Capital Index. S&P 1500 companies (964 in final analysis). CCC increased approximately 2.4 days in 2023 versus the prior year (DSO +1.4 days, DIO +3.7 days, DPO +2.7 days). Total opportunity to release liquidity at top-quartile performance estimated at $707 billion, of which $353 billion sits in inventory (DIO), $223 billion in receivables (DSO), and $130 billion in payables (DPO).
Visa, Growth Corporates Working Capital Index. Mid-market growth corporates (annual revenue $50M–$1B). 2024-2025 report based on 1,297 CFOs and Treasurers across 8 industry segments, 5 regions, and 23 countries: 84% faced cash flow gaps at least once in the prior year; 37% of invoices were paid early in 2024. 2025-2026 report based on 1,457 CFOs and Treasurers across 10 industry groups, 5 regions, and 23 countries: working capital reframed as a growth enabler.
This article originally appeared in the Practical Lean Finance newsletter on LinkedIn.
Practical Lean Finance is published on GoFast.Finance. The NWC Optimization course (CC-AA02) launches June 1, 2026.